Articles

As of the 23rd May 2022 this website is archived and will receive no further updates.

understandinguncertainty.org was produced by the Winton programme for the public understanding of risk based in the Statistical Laboratory in the University of Cambridge. The aim was to help improve the way that uncertainty and risk are discussed in society, and show how probability and statistics can be both useful and entertaining.

Many of the animations were produced using Flash and will no longer work.

Articles appearing in other places

This page contains the text of articles which have appeared in newspapers and magazines, as well as links to articles on other people's websites.

A visualisation of the information in NHS Breast Cancer Screening leaflet

breast-leaflet.jpg

The current NHS Breast Screening leaflet contains some fairly complex information which can be summarised using the graphic below.

What is your 'effective age'?

How old are you?

You might, quite reasonably, calculate your chronological age as the time elapsed since you were born. But what is the effective age of your body?

Using expected frequencies when teaching probability

The July 2014 Mathematics Programmes of Study: Key Stage 4 (GCSE) specifies under Probability

{calculate and interpret conditional probabilities through representation using expected frequencies with two-way tables, tree diagrams and Venn diagrams}.

- the brackets and bold case means this comes under additional mathematical content to be taught to more highly attaining pupils.

Microlives

30 minutes
Acute risks, such as riding a motorbike or going skydiving, may result in an accident - a natural unit for comparing such risks is the Micromort, which is a 1-in-a-million chance of sudden death, for some defined activity.

Visualising uncertainty

We have had a review paper published in Science called Visualising uncertainty about the future, although it primarily focuses on probability forecasts.

You may access the full paper by following the links below.

ESP and the significance of significance

A controversy about experiments in extra-sensory perception throws some light, and maybe some confusion, on the idea of statistical significance. This article discusses a common misinterpretation of the results of significance tests, and investigates some criticisms of significance tests in general.

Pure Randomness in Art

Random glassThis article is based on a talk I gave at the recent John Cage exhibition in Kettles Yard gallery in Cambridge. Cage is perhaps best known for his avant-garde music, particularly his silent 1952 composition 4′33″ but also for his use of randomness in “aleatory music”.

The Maths of Paul the “Psychic” Octopus

England’s performance in the World-Cup last summer was thankfully overshadowed by the attention given to Paul the Octopus, who was reported as making an unbroken series of correct predictions of match winners. Here we present a mathematical analysis of Paul’s performance in an attempt to answer the question that (briefly) gripped the world: was Paul psychic?

What are the chances of successful fertility treatment?

iconThe Human Fertilisation and Embryology Authority (HFEA) recently launched their ‘Choose a Fertility Clinic’ website which provides a huge range of information about each clinic licenced by the HFEA, with a lot of fairly complex statistics. The website carefully avoids direct comparisons and any hint of a ‘league table’, but here we look at whether we can draw statistically-valid conclusions about whether some clinics, for whatever reason, really do provide higher chances of success than others.

Survival Worldwide

Link to Survival AnimationOur Survival Worldwide animation visualises life table data from the Human Life Database maintained by the Max Planck Institute for Demographic Research (Rostock, Germany), the Department of Demography at the University of California (Berkeley, USA), and the Institut national d'études démographiques (Paris, France).

Screening for disease and dishonesty

A secret government agency has developed a scanner which determines whether a person is a terrorist. The scanner is fairly reliable; 95% of all scanned terrorists are identified as terrorists, and 95% of all upstanding citizens are identified as such. An informant tells the agency that exactly one passenger of 100 aboard an aeroplane in which in you are seated is a terrorist. The agency decide to scan each passenger, and the shifty looking man sitting next to you tests positive. Were you sitting next to a terrorist? What are the chances that this man really is a terrorist?

2845 ways to spin the Risk

In the animation below we show how risks can be ‘spun’ to look bigger or smaller, how medical treatments can be made to seem useless or to be wonder cures, and how lifestyle changes might look worthwhile or not worth bothering with. All by changing the words used, the way the numbers are expressed, and the particular graphics chosen.

A predictable pattern of murder?

Violence in London attracts headlines. After four people were murdered in separate incidents in London on 10th July 2008, BBC correspondent Andy Tighe said "To have four fatal stabbings in one day could be a statistical freak". But could it?

What was the probability that Barack Obama would win the US election?

On the face of it this seems an odd question. After all, he won. But before the election it was uncertain whether Obama would win, and probability is the way that uncertainty is quantified, so maybe it is reasonable to ask what that probability was.

Nightingale's 'Coxcombs'

Nightingale's coxcombsThrough her work as a nurse in the Crimean War, Florence Nightingale was a pioneer in establishing the importance of sanitation in hospitals. She meticulously gathered data on relating death tolls in hospitals to cleanliness, and, because of her novel methods of communicating this data, she was also a pioneer in applied statistics. We explore the work of Nightingale, and in particular focus on her use of certain graphs which, following misreading of her work, are now commonly known as 'coxcombs'.

What is Probability?

diceWe use phrases like "the probability of this coin coming up heads is 1/2", and "the odds on Manchester United winning their match are 2 to 1", and "the chance of dying of cancer is 30%". But what do these numbers actually mean? There are fundamentally different views about this, which can lead to very different ideas about how to deal with uncertainty.

How long are you going to live?

red manNone of us are going to last for ever. Our prospects depend on our sex, our age, our lifestyle, our genes, and many other personal factors both known and unknown. Even with all this information we're all uncertain about the exact date of our death, but by looking at large groups of people who are like us, we can count how many die each year and so get an idea of the risks we face and how long we might live. Our risks can be summarised in different ways which are shown in the animation below.

Risk in the media

Why risk in the media?

headlines from newspaperNo-one can be an expert in every subject. We may have left formal science teaching behind at school, or have continued through university. We may keep up to date by reading scientific periodicals and websites - or just wish we had the time to do so! But as news breaks of yet another scientific discovery, we all start with what the media have made of the story, and how they present it to us.

Coincidences

Who's birthday...You bump into an old friend you haven't seen for years.
You find that you share a birthday with not just one but two other people in your office.
You win the lottery!

Football Leagues

cartoon football playerThe Premier League is the main English football league, with 20 teams each playing a home and away against each other team making, 38 matches for each team in a season, and 380 matches altogether. Teams are awarded 3 points for a win, 1 for a draw, 0 for losing, and the league position is decided on total points, with equal points decided by goal difference (goals for minus goals against). At the end of the season the bottom 3 teams are relegated.

National Lottery

Lottery
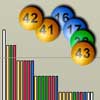
The UK National Lottery began on 19th November 1994 and there had been 1240 draws up to 20th October 2007. The jackpot prize is won by choosing in advance the 6 numbers that will be drawn from a set of balls numbered from 1 to 49. We can use the history of the lottery to illustrate many aspects of the theory of probability: how each draw is individually unpredictable, and yet the overall history shows predictable patterns; how a `league table' of numbers can be created that appears to show some numbers are preferentially drawn, and yet the table is completely spurious; how to test whether the balls are truly being drawn at random; how extremely unlikely events will occur if you wait long enough, and so on.