May the best team win
As of the 23rd May 2022 this website is archived and will receive no further updates.
understandinguncertainty.org was produced by the Winton programme for the public understanding of risk based in the Statistical Laboratory in the University of Cambridge. The aim was to help improve the way that uncertainty and risk are discussed in society, and show how probability and statistics can be both useful and entertaining.
Many of the animations were produced using Flash and will no longer work.
Luck or skill? suggested using the average number of points per match as an estimate of an underlying quality measure, leading to confidence intervals and uncertainties about ranks. Here we discuss a simple mathematical model that gave rise to those results.
What distribution of points would you get by chance alone?
Suppose all the teams were of equal standard, so that each match resulted in a home win with probability $p_H$, a draw with probability $p_D$, and an away win with probability $p_A$, where $p_H + p_D+ p_A = 1$. Let $X_H$ be the number of points a team wins in a home match, Then we can calculate the mean and variance of $X_H$ to be
$$m_H = E(X_H) = 3p_H + p_D,$$
$$v_H = V(X_H) = E(X_H^2) - m_H^2 = 9p_H + p_D -m_H^2.$$
Similarly, if $X_A$ is the number of points a team wins in an away match, then
$$m_A = E(X_A) = 3p_A + p_D,$$
$$v_A = V(X_A) = E(X_A^2) - m_A^2 = 9p_A + p_D -m_A^2.$$
If in a season there are $N/2$ home and $N/2$ away matches, then the total points $T$ at the end of the season is the sum of all the points in the individual matches, and so has mean and variance
$$m_T = E(T) = \frac{N}{2} ( m_H+m_A) = \frac{N}{2} \left( 3(p_H+p_A) + 2p_D\right) = \frac{N}{2}(3-p_D),$$
$$v_T = V(T) = \frac{N}{2} ( v_H+v_A) = \frac{N}{2}\left( 9(p_H+p_A) + 2p_D - m_H^2 -m_A^2 \right) = \frac{N}{2}(9-7p_D - m_H^2 -m_A^2).$$
For the observed proportions $p_H = 0.48, p_D = 0.26, p_A =0.26$, we obtain $m_T = 52.1, v_T= 61$.
The variance of the actual league-points at the end of the season was 239, compared with the theoretical variance of 61 were the teams all of equal quality and the results of the matches essentially due to chance. Since 61 / 239 = 26, we conclude that 26% of the variance in the Premier league points is due to chance. The standard deviation of the observed points, which is the square root of the variance, is roughly equal to 15, while that of the random points is around 8. This means that the observed points have about twice the range of the random points, so about half the spread of points is due to chance alone.
How sure can we be about the true quality of each team?
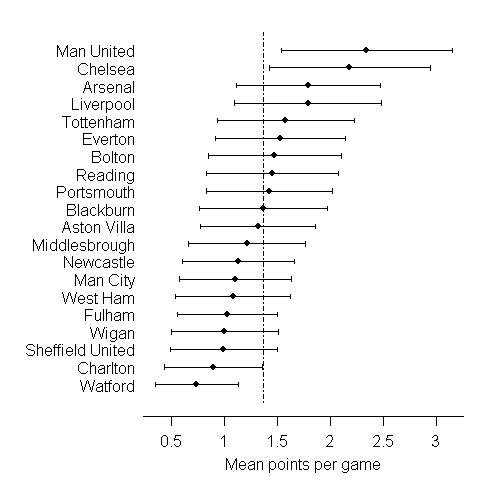
The end-of-season point-total describes how well each team has performed, but could also be viewed as an estimate of some measure of underlying quality. This is perhaps best seen by dividing the total by 38 to get 'mean points per game'. Their final score on this scale can be viewed as an estimate of a (theoretical) quantity: the mean points they would score per game were the season to continue indefinitely. By estimating the variance of this estimator and making some broad assumptions based on the central limit theorem, we can place a confidence interval around the observed mean points per game which expresses our uncertainty about the true underlying 'quality' of each team.
We therefore repeat the above analysis for individual teams, using the breakdown of their results at the end of the season to estimate their home-win / draw /away-win probabilities. For example, when Arsenal played at home they won 12, drew 6, and lost 1, and when playing away they won 7, drew 5, and lost 7. This total of 19 wins and 11 draws gave them a mean of 68/38 = 1.79 points per game, which we shall label as $m$. The variance of the home points is 109.1 , the variance of the away points is 66.1, so the total variance is $175.2$, which leads to an estimated variance of the mean-points-per-game of $v = 175.2/38^2 = 0.12$ . This can be used to place a confidence interval around $m$ with bounds $m \pm 1.96*\sqrt{v}$, giving an interval of 1.11 to 2.47 . The intervals for all the teams are shown below.
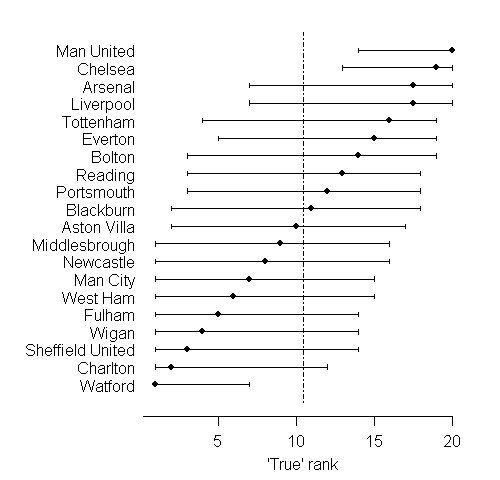
How sure can we be about the appropriate rank of each team?
Once we take the final mean number of points per game as an estimate of an unknown 'quality' measure, it then becomes reasonable to view the observed rank of the team in the league table as an estimate of the true underlying rank of the team. Intervals expressing our uncertainty of this true rank are easiest to obtain by simulation: essentially each interval is treated as representing a Normal distribution, and then at each iteration of the simulation a value is drawn from each distribution, and the values for the 20 teams are ranked and the rank of each team recorded. Repeating this process for 1000 simulations gives a distribution over the plausible ranks for each team, which are summarised by the 95% intervals shown below.
These ranking techniques can be adapted to assess the chances of results of specific matches, generally predicting actual scores rather than win/lose/draw directly. Naturally these ideas are widely used by sports betting organisations.
Further reading and links
Marshall and Spiegelhalter (1998)
- Log in to post comments

Comments
Anonymous (not verified)
Tue, 26/10/2010 - 8:20am
Permalink
question on calculation
Anonymous (not verified)
Tue, 29/03/2011 - 2:30pm
Permalink
Mean PPG by team