Luck or skill?
As of the 23rd May 2022 this website is archived and will receive no further updates.
understandinguncertainty.org was produced by the Winton programme for the public understanding of risk based in the Statistical Laboratory in the University of Cambridge. The aim was to help improve the way that uncertainty and risk are discussed in society, and show how probability and statistics can be both useful and entertaining.
Many of the animations were produced using Flash and will no longer work.
Premier League showed how the points in the Premier League table developed over the 2006-2007 season, but what distribution of points would you get by chance alone?
Here is an animation of the 2006-2007 season.
Click to enlarge the animation
Click on show theoretical distribution to see a theoretical distribution for the points if all the games were decided by chance alone. What does this mean? Overall, 48% of matches are home wins, 26% draws, and 26% away wins - we call this the "48/26/26" law. Suppose all the teams were indistinguishable in their skills (which might happen in the unlikely case that before each weekend, players for each team were selected at random from all the players in the Premier League). We can then calculate the expected point distribution that would happen if all matches were decided according to the 48/26/26 law.
At the end of the season some teams are clearly outside the theoretical distribution were all the teams the same, and so we can conclude there are genuine differences between the teams. However a certain amount of the spread of the final points is explainable by chance alone, - in May the best team win we show that around half the spread of points is due to chance.
How sure can we be about the true quality of each team?
The final ranking depends on the total number of points, or equivalently the average number of points per game. We might use this as a measure of the underlying 'quality' of a team, and treat it as some true underlying characteristic that we are trying to estimate based on a limited sample of 38 games. Using some statistical techniques described in May the best team win we can derive 95% confidence intervals for the true underlying 'quality' - we might think of 'average number of points per game' that would be achieved were the season to continue indefinitely (and all the teams stay at a constant level of skill).
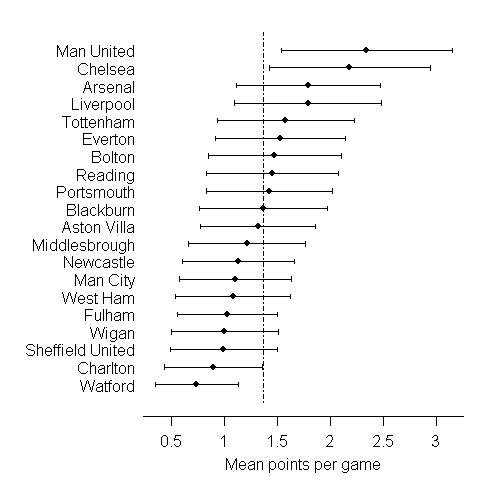
The confidence intervals above show that only Manchester United and Chelsea can be reasonably claimed to be better than average, while we can be confident that Charlton and Watford are below average.
How sure can we be about the appropriate rank of each team?
We can go further and assess the plausible 'true rank' of each team, in terms of their underlying quality as measured by average points per game. May the best team win shows how to do this.
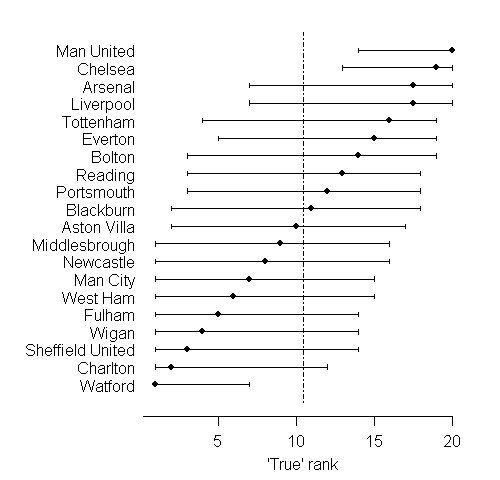
There is huge uncertainty as to the true ranks of the teams: this is typical of many applications of league tables. Manchester United and Chelsea again come up as the only teams we can be reasonably sure are in the top half, while only Watford cn be confidently placed in the bottom half.
We can also consider the probability that the season's winner, Manchester United, really was the best team: we assess this to be 53%, compared to 31% for Chelsea. This could be interpreted as the probability that Chelsea would actually end up top of the league table were the season to continue indefinitely.
Were the teams that were relegated really the three worst teams? We assess the probability of being in the bottom 3 for 'auality' as 77% for Watford, 47% for Charlton Athletic, and 30% for Sheffield United. Wigan and Fulham narrowly escaped relegation, and in fact we assess for each a 28% probability of truly being in the bottom 3 teams.
Further reading and links
Alan Lee has carried out a similar ranking analysis in Modeling Scores in the Premier League: Is Manchester United Really the Best? in Anthology of Statistics in Sports
Beating the Odds: The Hidden Mathematics of Sport by Rob Eastaway and John Haigh covers, among other topics, football league tables and comparisons with simulations.
- Log in to post comments
