Nightingale's 'Coxcombs'
As of the 23rd May 2022 this website is archived and will receive no further updates.
understandinguncertainty.org was produced by the Winton programme for the public understanding of risk based in the Statistical Laboratory in the University of Cambridge. The aim was to help improve the way that uncertainty and risk are discussed in society, and show how probability and statistics can be both useful and entertaining.
Many of the animations were produced using Flash and will no longer work.
![]() Through her work as a nurse in the Crimean War, Florence Nightingale was a pioneer in establishing the importance of sanitation in hospitals. She meticulously gathered data on relating death tolls in hospitals to cleanliness, and, because of her novel methods of communicating this data, she was also a pioneer in applied statistics. We explore the work of Nightingale, and in particular focus on her use of certain graphs which, following misreading of her work, are now commonly known as 'coxcombs'.
Through her work as a nurse in the Crimean War, Florence Nightingale was a pioneer in establishing the importance of sanitation in hospitals. She meticulously gathered data on relating death tolls in hospitals to cleanliness, and, because of her novel methods of communicating this data, she was also a pioneer in applied statistics. We explore the work of Nightingale, and in particular focus on her use of certain graphs which, following misreading of her work, are now commonly known as 'coxcombs'.
In March 1854 war broke out between France, Great Britain, Sardinia, and the Ottoman Empire on one side, and Russia on the other side. Most of the fighting in the war occurred on the Crimean Peninsula, in the south of Ukraine, but wounded British troops were shipped across the Black Sea to hospitals in Turkey. The sanitary conditions of these hospitals were awful, and many more people died from diseases than from wounds.
Florence Nightingale arrived in Turkey in October 1854 with a group of women to work as voluntary nurses in the hospitals. They were initially denied entry to the wards, and it was not until the hospitals had reached a critical state in March 1855 that Nightingale and her fellow nurses were allowed proper access to the patients.
Nightingale realised that soldiers were dying needlessly from malnutrition, poor sanitation, and lack of activity. She strove to improve living conditions for the wounded troops, and kept meticulous records of the death toll in the hospitals as evidence of the importance of patient welfare.
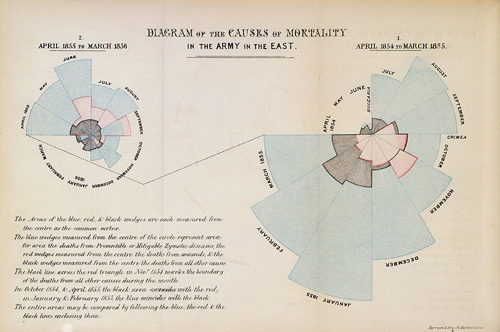
After the war, Nightingale returned to Great Britain and continued to fight for better conditions in hospitals. She created graphs, which are often described as roses or coxcombs (although she did not refer to them as such), to highlight the death toll from diseases above the death toll from wounds in the Crimean War. One of her original graphs is shown in the following image.

Nightingale's coxcombs
Below is an interactive reproduction of this pair of coxcombs. Switch to Full Screen mode to get a better view of the animation.
The data used to generate the Diagram of the Causes of Mortality in the Army in the East can be found in Mathematics of the Coxcombs.
There are two more articles on Florence Nightingale, the Crimean War, and coxcombs in this series
- To learn more about the history of the Crimean War, and Nightingale's role in the war, read Florence Nightingale and the Crimean War.
- To learn more about the mathematics of Nightingale's coxcombs, read Mathematics of the Coxcombs.
We recommend the following external works on Nightingale and coxcombs.
- Florence Nightingale and polar area diagrams is a detailed account of Nightingale, statistics, and coxcombs.
- Nightingale's roses in Actionscript 3 is a fantastic blog on animating coxcombs.
- Worth a thousand words is an inspiring article on Nightingale's coxcombs, and other fine graphics.
- Florence Nightingale's Statistical Diagrams contains a discussion of the erroneous, although now common, use of the term 'coxcomb', as well as a widely used modern diagram of the pair of coxcombs shown on this page.
- War and Medicine is an exhibition (22 November 2008 to 15 February 2009) by the Wellcome Trust on the development of medicine in response to warfare, from the Crimean War to present fighting in Iraq and Afghanistan.
- Log in to post comments
