Submitted by mlc40 on Fri, 27/03/2009 - 4:30pm
Our first screening example featured a fictitious terrorist-detecting device that was not very accurate. However, as this real example shows, even when the tests are incredibly accurate we still get some surprising results if the underlying condition is rare.
Submitted by david on Mon, 23/03/2009 - 7:58am
A secret government agency has developed a scanner which determines whether a person is a terrorist. The scanner is fairly reliable; 95% of all scanned terrorists are identified as terrorists, and 95% of all upstanding citizens are identified as such. An informant tells the agency that exactly one passenger of 100 aboard an aeroplane in which in you are seated is a terrorist. The agency decide to scan each passenger, and the shifty looking man sitting next to you tests positive. Were you sitting next to a terrorist? What are the chances that this man really is a terrorist?
Submitted by gmp26 on Mon, 23/02/2009 - 9:45am
In the animation below we show how risks can be ‘spun’ to look bigger or smaller, how medical treatments can be made to seem useless or to be wonder cures, and how lifestyle changes might look worthwhile or not worth bothering with. All by changing the words used, the way the numbers are expressed, and the particular graphics chosen.
Submitted by ims25 on Wed, 05/11/2008 - 4:08pm
 Through her work as a nurse in the Crimean War, Florence Nightingale was a pioneer in establishing the importance of sanitation in hospitals. She meticulously gathered data on relating death tolls in hospitals to cleanliness, and, because of her novel methods of communicating this data, she was also a pioneer in applied statistics. We explore the work of Nightingale, and in particular focus on her use of certain graphs which, following misreading of her work, are now commonly known as 'coxcombs'.
Submitted by gmp26 on Wed, 22/10/2008 - 9:57am
This is still a work in progress, but we thought you might be interested in these different ways the data in Charles Minard's map can be visualised. The Minard map is a beautifully clear summary of the progress of Napoleon's 1812 campaign. It depicts a broad river of men flowing eastwards, suffering continuous depletion from disease, desertion and death, with just a few surviving the disastrous retreat.
Submitted by horace on Mon, 07/01/2008 - 12:08pm
 None of us are going to last for ever. Our prospects depend on our sex, our age, our lifestyle, our genes, and many other personal factors both known and unknown. Even with all this information we're all uncertain about the exact date of our death, but by looking at large groups of people who are like us, we can count how many die each year and so get an idea of the risks we face and how long we might live. Our risks can be summarised in different ways which are shown in the animation below.
Submitted by horace on Mon, 03/12/2007 - 10:13am
 In this animation, the computer simulates a number of people $N$ choosing a number at random between 1 and $(\frac{N}{2})^2$. So, for example, it will simulate 400 people choosing a number between 1 and 40000.
How often would you expect it to pick the same number twice?
Submitted by david on Fri, 16/11/2007 - 4:54pm
 The Premier League is the main English football league, with 20 teams each playing a home and away against each other team making, 38 matches for each team in a season, and 380 matches altogether. Teams are awarded 3 points for a win, 1 for a draw, 0 for losing, and the league position is decided on total points, with equal points decided by goal difference (goals for minus goals against). At the end of the season the bottom 3 teams are relegated.
Submitted by david on Wed, 07/11/2007 - 3:59pm
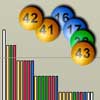 The UK National Lottery began on 19th November 1994 and there had been 1240 draws up to 20th October 2007. The jackpot prize is won by choosing in advance the 6 numbers that will be drawn from a set of balls numbered from 1 to 49. We can use the history of the lottery to illustrate many aspects of the theory of probability: how each draw is individually unpredictable, and yet the overall history shows predictable patterns; how a `league table' of numbers can be created that appears to show some numbers are preferentially drawn, and yet the table is completely spurious; how to test whether the balls are truly being drawn at random; how extremely unlikely events will occur if you wait long enough, and so on.
