A predictable pattern of murder?
As of the 23rd May 2022 this website is archived and will receive no further updates.
understandinguncertainty.org was produced by the Winton programme for the public understanding of risk based in the Statistical Laboratory in the University of Cambridge. The aim was to help improve the way that uncertainty and risk are discussed in society, and show how probability and statistics can be both useful and entertaining.
Many of the animations were produced using Flash and will no longer work.

Violence in London attracts headlines. After four people were murdered in separate incidents in London on 10th July 2008, BBC correspondent Andy Tighe said "To have four fatal stabbings in one day could be a statistical freak". But could it?
And on July 28th thelondonpaper had the front-page headline: “London’s murder count reaches 90”. Of course every single murder is a tragedy for those whom it affects, and it is little comfort to them what patterns we may detect in the figures. But for the benefit of the police service and broader society we may wish to consider whether these ‘shocking’ numbers in the media are evidence that things are really getting worse.
Each year the London Metropolitan Police record around 170 homicides, and this has been stable for the last 5 years (‘homicide’ covers murder, manslaughter and infanticide, but here we will use ‘murder’ as an equivalent term). We will also focus on all murders, whatever the method of killing. Each of these murders is an individual crime that cannot be predicted. It may appear strange, but this very randomness means that the overall pattern of murders is in some ways quite predictable. Using some basic probability theory, and assuming that the level of violence remains the same, we can answer the questions coming out of the two stories given above: first, 4 murders in a day is unusual but not extraordinary (we would expect it to occur around once every three years), and second, we would have expected 93 murders by July 28th and so the count of 90 is not at all surprising.
We can also answer questions such as: how often would we expect days with no murders? (around 64% of days); how often could we expect 3 or more murders in one day? (around 4 days a year); and how often should we expect there to be long gaps between murders? (a gap of 7 days should occur around 6 times a year).
Why should anyone care about this? By making full use of the kind of data collected by the Home Office Specialist Crime & Police Resources team, we feel that both the public and police forces can be alert to real changes in the incidence of crime, while not being either unnecessarily alarmed or falsely reassured by apparent variability. This analysis is part of our contribution to the work of the Risk and Regulation Advisory Council (RRAC) in trying to stimulate public interest in a debate about 'risk' in policing following on from Sir Ronnie Flanagan's Review of Policing.
We have looked at the pattern of murders in London between April 2004 and March 2007. Over these 1095 days there were a total of 508 homicides recorded by the Metropolitan Police. 12 were on an unknown date, and 13 were the result of the bombings on July 7th 2005 (other victims were recorded by the British Transport Police) which is an exceptional ‘cluster’ that should be dealt with separately: removing these leaves 483 homicides on known dates. Figure 1 shows the number of homicides each day over this 3 year period: there was one day on which there were 4 murders recorded (8th April 2006), but also a gap of 12 days (15th to 26th February 2007) in which no murders were recorded at all.
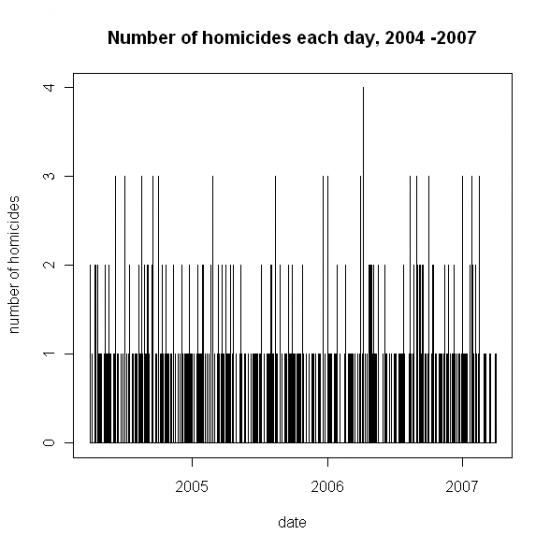
Figure 1. Number of homicides recorded each day in London between April 2004 and March 2007
How predictable is the overall pattern of murders? Overall there are around 13 murders a month, which is 3 a week or on average one every 54 hours. We can start by pretending that murders just happen as unconnected events with around a 1 in 50 chance of one happening each hour. Of course murders do not occur in this way, and in particular we know that the risk of any specific individual being murdered can depend strongly on age, gender, geography, ethnicity and so on. But here we are dealing with the total over the whole London population of over 7 million, and we can use probability theory to tell us what we would expect to see if murders did occur as ‘random’ events, and check whether this fits with the observed pattern. The idea is that we can make many predictions about the pattern of murders, based only on knowing the overall number over 3 years.
Can we predict how many days there are no murders, one murder, and so on?
First we can look at how many murders happen each day. If murders happened as random events, the number of murders each day would follow a Poisson distribution with a mean of 0.44. Over 3 years we would expect the pattern shown in Table 1 and Figure 2.
| Number of homicides per day | 0 | 1 | 2 | 3 | 4 | 5 or more |
|---|---|---|---|---|---|---|
| Predicted | 705.2 | 310.3 | 68.3 | 10.0 | 1.1 | 0.1 |
| Observed | 713 | 299 | 66 | 16 | 1 | 0 |
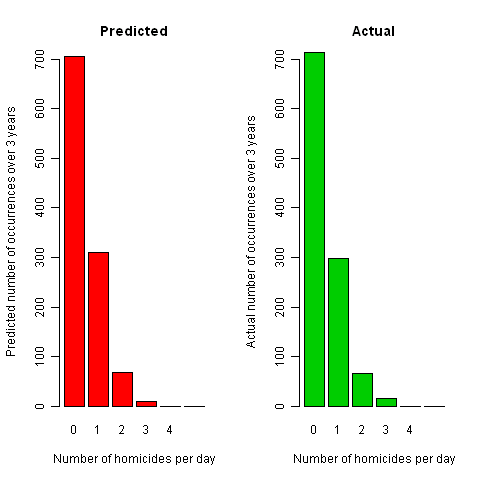
Figure 2. Frequency of occurrence of days with different numbers of homicides recorded in London between April 2004 and March 2007
The actual numbers of days with 0, 1, 2 and so on homicides are shown in Table 1 and drawn in Figure 2: it is clear that there is a very close match between the observed and expected distribution: in particular we would have expected one day with 4 murders, and we observed 1, and 64% (705.2/1095) of days with no murders, and the observed proportion was 65% (713/1095). Formally, a chi-squared test shows no evidence against the Poisson distribution (simulation-based P-value of 0.44), and reminds us of the famous nineteenth century example which showed a similar excellent fit of the Poisson distribution to the number of Prussian officers kicked to death by their horses each year.
Figure 3 shows the distribution of homicides by day and month: a Poisson regression reveals there is no evidence for homicide rates to depend on the month, but there is a significant ‘Saturday effect’ of around 60% increase in homicide rate compared to all other days of the week combined. However taking this into account does not make much difference to the predictions or the quality of the fit.
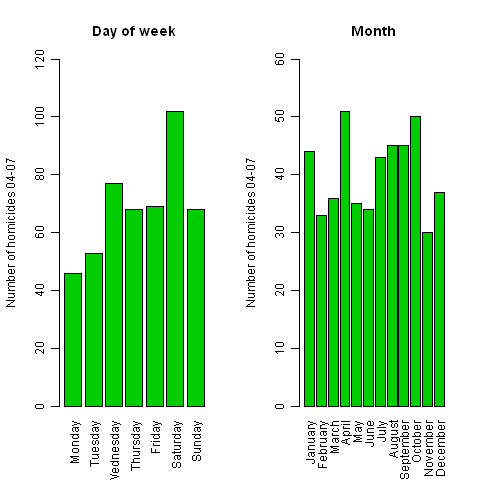
Figure 3. Frequency of occurrence of homicides on different days and months in London between April 2004 and March 2007
Can we predict how often there will be long gaps between murders?
The average gap between murders is 54 hours. But they do not happen in a regular pattern and the gap can be a lot less and a lot more than 54 hours. We can use our probability model to predict how often there will be murders on consecutive days, how often there will be a day without a murder, and so on. The predicted pattern for 2004-7 is shown in Figure 4: for example we predict that there will be 135 occasions on which there are murders on consecutive days, but also 18 occasions in which there is a gap of at least 7 clear days between murders, and 2 occasions in which there is a gap of 12 days.

Figure 4. Frequency of different length intervals between homicides recorded in London between April 2004 and March 2007
The observed pattern for 2004-7 is also shown in Figure 4, and follows the predicted pattern reasonably well: there were actually 143 occasions on which there were murders on consecutive days, 19 occasions in which there was a gap of at least 7 clear days between murders, and 1 occasion in which there was a gap of 12 days (between 15th February and 26th February 2007).
Can we predict how many murders there will be in London in 2008?
If we assume there is no major change in circumstances between 2004-7 and 2008, then we can predict how many murders will be recorded in London during 2008.
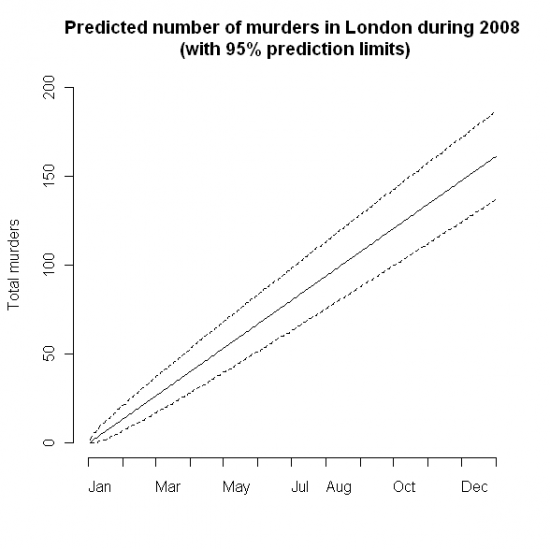
Figure 4: Predicted number of murders in London in 2008
We expect there to be a total of 161 murders during 2008, and although of course it is unlikely to be exactly that figure, we can be 95% sure that the total will be between 137 and 187. We can also read off the totals for specific dates: for example by July 28th we would expect around 93 murders, and be 95% sure there will be between 74 and 112. In fact on July 28th the following headline appeared in a London paper - almost exactly the prediction we can make based on the historical data.
So we can't predict individual murders, but their pattern is highly predictable. This should mean we can be ready for events that appear to be good (a long gap between murders) or bad (3 or more murders on the same day) - both events are to be expected by chance alone. But by knowing what pattern to be expect, then we should also be able to spot when something really unusual is happening.
For further information on crime statistics, see the latest report from the Home Office: Homicides, Firearm Offences and Intimate Violence 2006/07, 3rd edition. Also note the Metropolitan Police's statistical information including the number of murders per month.
.
- Log in to post comments

Comments
Anonymous (not verified)
Thu, 01/04/2010 - 2:43pm
Permalink
Predicting how many days there are no murders, one murder...
Anonymous (not verified)
Tue, 13/04/2010 - 5:54pm
Permalink
Answer to previous post
Ken Hewitt
Thu, 07/04/2016 - 12:18pm
Permalink
Request