Lottery expectations
As of the 23rd May 2022 this website is archived and will receive no further updates.
understandinguncertainty.org was produced by the Winton programme for the public understanding of risk based in the Statistical Laboratory in the University of Cambridge. The aim was to help improve the way that uncertainty and risk are discussed in society, and show how probability and statistics can be both useful and entertaining.
Many of the animations were produced using Flash and will no longer work.
 National lottery shows how many times each of the numbers has come up in the main National Lottery draw, and what were the gaps between appearances of each number. Here we look at whether the observed distribution of the number of times each of the 49 numbers has come up fits with what would be expected with a truly random draw, and whether the gaps also correspond to what might be expected.
The number of appearances of each number
If the lottery balls are being chosen at random, then the distribution of the number of times each ball comes up should follow the theoretical shape shown in white. Use the playback controls below the animation to restart, pause, or fast forward the draws.
Click to enlarge the animation
Of course the actual distribution is more jagged, but the theoretical distribution allows us to see whether the 'leading' number is surprisingly far in front. Below we see the final observed distribution with an approximate theoretical distribution superimposed. The fit looks good, suggesting, as we would expect, that there is no systematic preference for particular numbers.
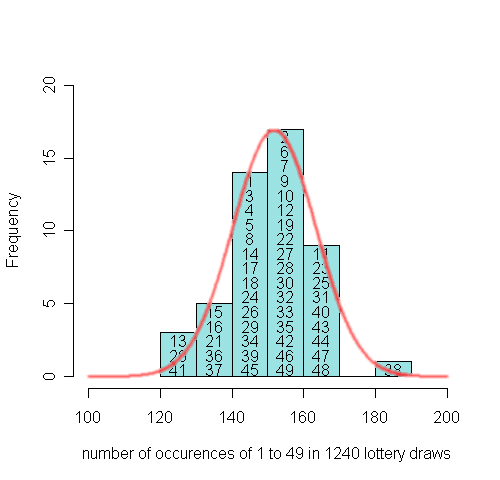
In Is the Lottery biased? we consider some of the mathematics behind the theoretical distribution of counts, and how we can check if the observed distribution is in conflict with the theoretical one.
Are the gaps what we would expect?
If you run the animation below, then if the lottery balls are being chosen at random, the distribution of the gaps should follow the theoretical shape in white when you click on 'Show histogram' and then 'Show theoretical'. This theoretical distribution is known as a Geometric distribution and is derived in Is the Lottery biased?.
Click to enlarge the animation
After 1240 lottery draws, with 6 main balls being drawn each time, $6\times 1240 = 7440$ numbers have been drawn, and so there are 7440 gaps between two draws of the same number (the gaps until the first time each number is drawn are included in this total). The histogram below shows the distribution of all these 7440 gaps, with the theoretical geometric distribution superimposed. The gaps are divided into those below and above 40, so that the large gaps are clearly displayed: the theoretical distrbution seems to fit the observed distribution well, although there are inevitably some jagged bits in the tail.
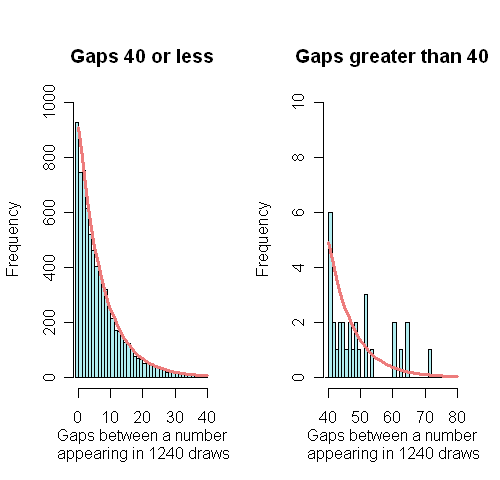
The longest gap observed is 72, for number 17 , which appeared on draw 435 on 23rd February 2000, but did not appear again until draw 508 on 4th November 2000. How surprising is it to get a gap as large as this? After a specific occurrence of a particular number, this is extremely surprising, and there is only 8/100000 chance of such an extreme result. However, when we take into account that there were 7440 gaps observed and this was the largest one, it turns out that it is not surprising at all. In fact 72 is almost exactly the average maximum gap one would expect in a series of 1240 lottery draws!
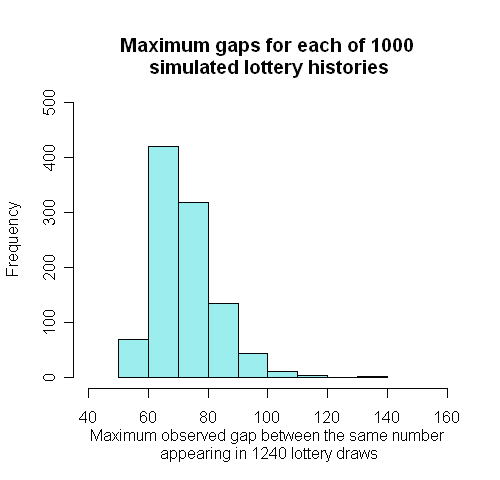
Alternatively we can use the power of the computer to simulate 'fictional' lotteries, by picking 6 different numbers at random from 1 to 49, and then repeating this process as long as we want. The software contains 'random number generators' that should ensure that each number really does have an equal chance of being chosen. We simulated 1000 full lottery histories and found the longest gap in each history. These 1000 longest gaps had the distribution shown below: 420 out of 1000 were 72 or more.
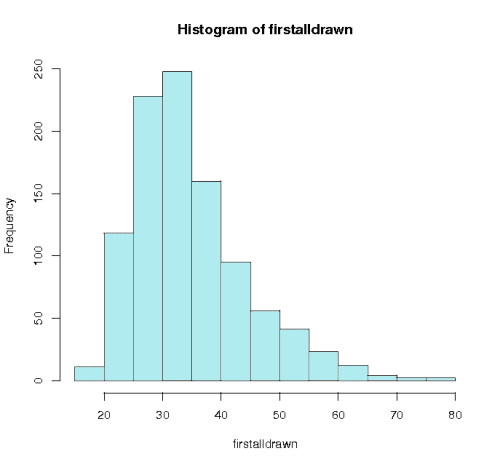
As another example of using simulations, looking backwards from 20th October 2007, we saw that ball 14 was not drawn until the 53rd draw. The graph below shows the results of simulating 1000 lotteries until all the numbers had come up. In 60 of these simulations we had to wait until at least 53 draws before all the numbers had come up, showing the time we had to wait for ball 14 was not really very surprising.
In Is the Lottery biased? we consider the mathematics behind the theoretical distribution of gaps.
- Log in to post comments
