Microlives
As of the 23rd May 2022 this website is archived and will receive no further updates.
understandinguncertainty.org was produced by the Winton programme for the public understanding of risk based in the Statistical Laboratory in the University of Cambridge. The aim was to help improve the way that uncertainty and risk are discussed in society, and show how probability and statistics can be both useful and entertaining.
Many of the animations were produced using Flash and will no longer work.

Acute risks, such as riding a motorbike or going skydiving, may result in an accident - a natural unit for comparing such risks is the Micromort, which is a 1-in-a-million chance of sudden death, for some defined activity.
However many risks we take don’t kill you straight away: think of all the lifestyle frailties we get warned about, such as smoking, drinking, eating badly, not exercising and so on. The microlife aims to make all these chronic risks comparable by showing how much life we lose on average when we’re exposed to them:
a microlife is 30 minutes of your life expectancy
Life expectancy for a man aged 22 in the UK is currently about 79 years, which is an extra 57 years, or 20,800 days, or 500,000 hours, or 1 million half hours. So, a young man of 22 typically has 1,000,000 half-hours (57 years) ahead of him, the same as a 26 year-old woman. We define a microlife as the result of a chronic risk that reduces life, on average, by just one of the million half hours that they have left.
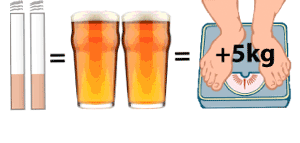
Here are some things that would, on average, cost a 30-year-old man 1 microlife:
- Smoking 2 cigarettes
- Drinking 7 units of alcohol (eg 2 pints of strong beer)
- Each day of being 5 Kg overweight
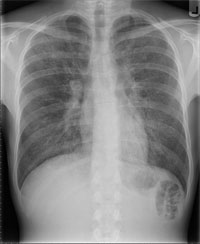
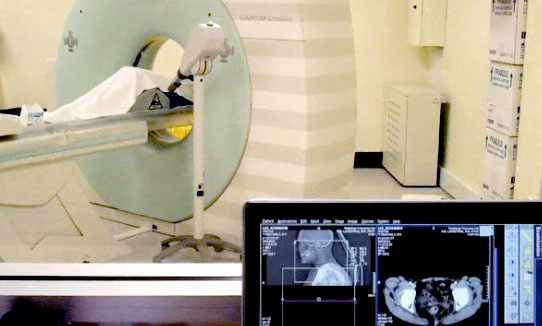
A chest X-ray will set a middle-aged person back around 2 microlives, while a whole body CT-scan would weigh in at around 180 microlives.
Details of the derivations of these quantities are given below.
Of course this is not a precise consequence of each cigarette smoked or drink drunk: it comes from accumulating the effects of a lifetime of behaviour and averaging it over a whole population. And these are very rough figures, based on many assumptions. If you just smoke 2 cigarettes and then stop it is impossible to say what long-term effect it will have on you, for a number of reasons. First, microlives are usually based on comparisons between different people rather than people who have changed behaviour (although below we consider evidence from people who stop smoking). Second, we can never know what would have happened had an individual done something different, the counterfactual.
There is a simple relationship between change in life expectancy and microlives per day. Consider a person aged around 30 with a life expectancy of 50 years, or 18,000 days. Then a daily behaviour or status that leads them to lose a year of life expectancy (17,500 microlives) means they are using up around one microlife every day of their lives.
The speed of living your life
Microlives encourage the metaphor that people go through their lives at different speeds according to their lifestyle. For example, someone who smokes 20 a day is using up around 10 microlives, which could be loosely interpreted as their rushing towards their death at around 29 hours a day instead of 24. This idea of premature ageing has been found to be an effective metaphor in encouraging behaviour change, such as the effect of telling people their 'lung age' - the age of a healthy person who has the same lung function as you (1). 'Heart age' is also becoming a popular concept.
An interesting issue is that life expectancy has been increasing by around 3 months every year for the last 25 years. This could be interpreted as follows: although just by living we are using up 48 microlives a day, our death is also moving away from us at 12 microlives a day. Essentially our health care system and healthier life-styles are giving us a bonus pay-back of 12 microlives per day. However, all this assumes lifetime behaviours and is not necessarily relevant for older people : in fact, as we get older, our life expectancy does not decrease by exactly 24 hours for each day that we survive, and so we don't even use up a full 48 microlives from just living through the day - see the technical appendix below.
So overall we can think of using up around 48 microlives just by living, getting 12 back thanks to healthcare improvements, and then losing or gaining a few due to our lifestyle, genes or environment. Of course the numbers are all very approximate - they should not be extrapolated to extreme behaviours and behaviours may interact.
What is the relation between a micromort and a microlife?
If we expose ourselves to a micromort, we take a 1-in-a-million chance that our future life will be 0, and hence our life expectancy is reduced by a millionth. Hence a young adult taking a micromort’s acute risk is almost exactly exposing themselves to a microlife. An older person taking the same risk, while still reducing their life-expectancy by a millionth, is only perhaps losing 15 minutes life-expectancy. However, acute risks from dangerous activities are not well expressed as changes in life expectancy, and so different units appear appropriate.
There is one big difference between micromorts and microlives. If you survive your motorbike ride, then your micromort slate is wiped clean and you start the next day with an empty account. But if you smoke all day and live on pork pies, then your microlives accumulate. It’s like a lottery where the tickets you buy each day remain valid for ever - and so your chances of winning increase every day. Except that, in this case, you really don’t want to.
What is the official value of a microlife and a micromort?
Governments also put a value on microlives. The UK National Institute for Health and Clinical Excellence (NICE) has guidelines that suggest the National Health Service will pay up to £30,000 if the treatment is expected to prolong life by one healthy year. That’s around 17,500 microlives. This means that NICE prices a microlife at around £1.70. The UK Department of Transport prices a ‘value of a statistical life’ at £1,600,000, which means they are willing to pay £1.60 to avoid a 1-in-a-million chance of death, or a micromort. So two government agencies put similar value on a microlife and a micromort.
Derivation of values
Smoking
A very basic analysis was carried out by Shaw et al 2000 BMJ (2), who estimated a 6.5 years difference in life-expectancy between smokers and non-smokers, which is 3,418,560 minutes. They considered median consumption of 16 cigarettes a day from ages 17 to 71, which comes to 311,688 cigarettes. Making the simplifying assumption that each cigarette contributes equally to the risk, this comes to 11 minutes a cigarette or around 3 cigarettes for a microlife.
Smokers, however, may have lower life-expectancy anyway because of type of person and other life-style factors. So a more sophisticated analysis would look at the effect of stopping smoking. Doll and Peto (2004) (3) analyse data on 40,000 UK doctors, many of whom gave up smoking during the period of the study from 1951 to 2001. They estimate a 40-year-old man who stopped smoking gained 9 years in life-expectancy, or 4,700,000 minutes. If he carried on smoking he only expected to live another 30 years or 11,000 days, during which he smoked 325,000 cigarettes (assuming the higher consumption of 30 a day in 1950s and 1960s). This works out at 15 minutes lost per cigarette smoked, or around 2 cigarettes for a microlife.
Alcohol
White et al (2002) (4) provide spreadsheets for the annual risk of all-cause mortality for different ages and quantities of alcohol drunk per week, in UK units. Consider a 20 year-old man who drinks 28 units a week (which is officially considered ‘hazardous’), rather than 7 units a week. His life expectancy is decreased by 6 months to 55 years, which works out at a loss of 4,400 hours or 8,800 microlives. During this period he will drink 3 units extra a day, which is 60,000 extra units of alcohol. Thence he loses 1 microlife per 7 units of alcohol consumed, which is about 2 pints of strong beer.
Weight
A recent paper (5) estimates a relative annual risk of 1.29 for all-cause mortality per 5 kg/sqm increase in body mass index (BMI) over the optimum of 22.5 to 25 kg/sqm. For a man of average height (1.75m), this corresponds to a relative risk of 1.09 per 5 kg overweight, where the optimal weight is taken as between 69 and 77 Kg. Using the formula derived from relative risks (below), this corresponds to a loss of around 0.95 years life-expectancy for a man aged 35 who is 5Kg overweight. He is expected to live around another 40 years or 15,000 days, This means he is losing around 350 days life-expectancy, 16,500 microlives, for every day he is overweight. So roughly 1 microlife lost for each day being 5Kg overweight.
Radiation
It is difficult to establish the risks from small doses of ionising radiation, as any effects on, say, cancer, have a long delay and so are masked by the substantial lifetime risk of developing cancer anyway. For larger doses the experience of survivors of the Japanese atomic bomb attacks can be used to build models, which then need to be extrapolated down to lower doses. Assuming a smooth extrapolation with no threshold under which ionising radiation poses zero risk, leads to estimates of around an average of 1 year of life lost per Sievert effective exposure when aggregated over a population (6) which, at an individual level, is perhaps best thought of as 1/1000 of a year [9 hours or 18 microlives] per milliSievert (mSv). This assumes an age distribution corresponding to the general population.
For a middle-aged person receiving say an effective dose of 0.1 mSv from a chest X-ray this corresponds to around 2 microlives. A whole-body CT scan delivers around 10 mSv, corresponding to 180 microlives of risk.
One needs to be careful extrapolating from these figures. A US National Cancer Institute study (7) estimated that the 70,000,000 CT scans carried out in the US in 2007 would eventually cause 29000 cancers. Assuming an average of 10mSv per CT, our very simple model would suggest a loss of 180 microlives per CT scan which would imply 700,000 years of life lost due to the CT scans in 2007. This is more than would be expected from 29,000 cancers and so is an over-estimate: as Berrington et al explain (7), such crude estimates do not take into account the older age of many people receiving CT scans.
Technical appendix: A simple way of obtaining change in life-expectancy from epidemiological studies
John Haybittle (1998) (8) (who was a very fine but modest statistician) describes very nicely how to approximate changes in life-expectancy from standardised mortality ratios (SMR) [the ratio of observed to expected deaths over a specified period] or hazard ratios [the ratio of the daily risk of death to the 'normal' risk] . This is based on the Gompertz approximation to human survival risk, where the annual risk of dying at age $t$ is approximated by a function $h_t = B e^{kt}$ - this says that the log(hazard) is linear, which is very accurate between ages 30 and 80. Assuming this Gompertz model, the life-expectancy $e_t$ at age $t$ is given by
$$ e_t = \frac{\log (1 + \frac{k}{h_t}) - \frac{1}{2}/(1+ \frac{h_t}{k})^2 }{k}.$$
For current survival, $k \approx 0.09$ for both men and women.
An SMR or hazard ratio $\lambda$ throughout the whole life leads to a change in life-expectancy at age $t$. This can be obtained by using the above formula but substituting $\lambda h_t$ for $h_t$.
When $h_t$ is small compared with $k$, which holds for ages below 40, the second term in the life expectancy becomes negligible, and the life expectancy can be approximated by $e_t \approx [\log (\frac{k}{h_t}) - \frac{1}{2}] / k$, and so the change in life expectancy is simply $- \log(\lambda)/k$. Since $k \approx 0.09$, the change in life expectancy from a lifetime excess risk $\lambda$ is roughly $-11 \log(\lambda)$ which for small excess risks is roughly $-11 (\lambda-1)$, so that something that raises your daily mortality risk by 1% ($\lambda=1.01$) will on average take around .11 years or 40 days off your life.
Very roughly, a person in their 30's facing, from some cause, a daily relative risk of death of 1.09 throughout their life is losing around 1 microlife per day. This follows as they expect to lose around 0.95 years in life-expectancy, or 17000 microlives, and yet expect to live another 50 years or so which is around 18000 days.
Technical appendix: Why don't older people use up 48 microlives a day just by living?
Suppose you have lived to $x$ days, and your probability of dying on each successive day is given by $p_{x+1}, p_{x+2}..$ and so on. The your life expectancy (in days) is given by
$$e_x = 1 p_{x+1} + 2 p_{x+2} + 3 p_{x+3} ... ,$$
where $p_{x+1} + p_{x+2} + p_{x+3} .. = 1$. If you then manage to live through the next day and so the event (your death) with probability $p_{x+1}$ did not occur, then your probability of dying on successive days is now changed to
$$ p_{x+2}/( 1- p_{x+1}), p_{x+3}/( 1- p_{x+1}) ..$$
and so on, which will again sum to 1. Your life expectancy now will be
$$e_{x+1} = 1 p_{x+2}/( 1- p_{x+1}) + 2 p_{x+3}/( 1- p_{x+1}) + 3 p_{x+4}/( 1- p_{x+1}) ... = (p_{x+2} + 2 p_{x+3} + 3 p_{x+4}..) /( 1- p_{x+1}) $$
which can be seen to be equal to $(e_x - 1)/ ( 1- p_{x+1}) $. This means that the reduction in life expectancy from living through day $x+1$ is
$$ e_x - e_{x+1} = 1 - p_{x+1}e_{x+1}.$$
If $p_{x+1}e_{x+1}$ is very low, then $ e_x - e_{x+1} \approx 1$ and so surviving a day means that your life expectancy is reduced by 24 hours or 48 microlives. But suppose you are old, with a life expectancy of only another 5 years (1800 days) and a 1 in 5000 chance of dying tomorrow. Then if you survive tomorrow, your life expectancy is only reduced by
1- 1800/5000 = 0.64, and so you have only lost 0.64 x 48 = 31 microlives. In the extreme case that you have a constant daily risk of dying, then $e_x = 1/ p_{x+1}$ and so living a day does not decrease your life expectancy - each day is started afresh. This is the case with a 'memory-less' exponential survival distribution, which does not hold at any time in normal human life - your daily risk is always expected to be increasing.
References
1. Parkes G, Greenhalgh T, Griffin M, Dent R. Effect on smoking quit rate of telling patients their lung age: the Step2quit randomised controlled trial. BMJ. 2008 Mar 15;336(7644):598–600.
2. Shaw M, Mitchell R, Dorling D. Time for a smoke? One cigarette reduces your life by 11 minutes. BMJ. 2000 Jan 1;320(7226):53.
3. Doll R. Mortality in relation to smoking: 50 years’ observations on male British doctors. BMJ. 2004 Jun 26;328:1519–0.
4. White IR, Altmann DR, Nanchahal K. Alcohol consumption and mortality: modelling risks for men and women at different ages. BMJ. 2002 Jul 27;325(7357):191.
5. Prospective Studies Collaboration. Body-mass index and cause-specific mortality in 900 000 adults: collaborative analyses of 57 prospective studies. The Lancet. 2009 Mar;373:1083–96.
6. Little MP, Hoel DG, Molitor J, Boice JD, Wakeford R, Muirhead CR. New models for evaluation of radiation-induced lifetime cancer risk and its uncertainty employed in the UNSCEAR 2006 report. Radiat. Res. 2008 Jun;169(6):660–76.
7. Berrington de Gonzalez A, Mahesh M, Kim K-P, Bhargavan M, Lewis R, Mettler F, et al. Projected Cancer Risks From Computed Tomographic Scans Performed in the United States in 2007. Arch Intern Med. 2009 Dec 14;169(22):2071–7.
8. Haybittle JL. The use of the Gompertz function to relate changes in life expectancy to the standardized mortality ratio. International Journal of Epidemiology. 1998 Oct 1;27(5):885–9.
- Log in to post comments

Comments
GHB (not verified)
Fri, 25/11/2011 - 11:20am
Permalink
Life expectancies
Rich (not verified)
Tue, 29/11/2011 - 4:23pm
Permalink
Alcohol's effects
Niall Scott (not verified)
Tue, 29/11/2011 - 5:02pm
Permalink
alcohol short and long term risks
Jonathan Bagley (not verified)
Wed, 30/11/2011 - 1:50pm
Permalink
microlives
Joan O'Hagan (not verified)
Sun, 25/12/2011 - 3:02pm
Permalink
Can I have that in microlives?
Tim Coote (not verified)
Wed, 04/01/2012 - 9:42pm
Permalink
Should alcohol be free on the NHS for the over 55s?
lleytonsanders
Tue, 14/05/2013 - 9:38am
Permalink
complicated computations
Carver
Fri, 04/09/2015 - 9:20am
Permalink
This article is an appealing