Submitted by kevin on Sun, 27/11/2011 - 6:31pm
Lots of press reports in the last couple of days on how UK women are the fattest in Europe, for example in the Daily Mail and on the BBC News website. I'm still in Berlin, and it was in the papers here too. The tabloid-style Berliner Kurier went with the headline "Man, they are fat, man", while the N24 news service went with "British and Maltese are the fattest Europeans". But is it another dodgy league table?
DJS, Times, 30th November 2009
Submitted by gmp26 on Sun, 24/05/2009 - 3:29pm
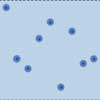
Canadian Lottery animations based on Lotto649 data.
Submitted by david on Mon, 03/12/2007 - 11:47am
Luck or skill? suggested using the average number of points per match as an estimate of an underlying quality measure, leading to confidence intervals and uncertainties about ranks. Here we discuss a simple mathematical model that gave rise to those results.
Submitted by david on Wed, 28/11/2007 - 4:18pm
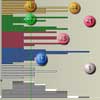
Premier League showed how the points in the Premier League table developed over the 2006-2007 season, but what distribution of points would you get by chance alone?
Submitted by david on Fri, 16/11/2007 - 4:54pm
 The Premier League is the main English football league, with 20 teams each playing a home and away against each other team making, 38 matches for each team in a season, and 380 matches altogether. Teams are awarded 3 points for a win, 1 for a draw, 0 for losing, and the league position is decided on total points, with equal points decided by goal difference (goals for minus goals against). At the end of the season the bottom 3 teams are relegated.
Submitted by david on Wed, 07/11/2007 - 5:28pm
 In Lottery Expectations we looked at the observed and theoretical distributions for the total count of times each number has come up, and the gap between a number's appearances. Here we explain the mathematics behind the theoretical distribution of counts, and how to check for true randomness, and derive the theoretical distribution for gaps.
Submitted by david on Wed, 07/11/2007 - 4:08pm
 National lottery shows how many times each of the numbers has come up in the main National Lottery draw, and what were the gaps between appearances of each number. Here we look at whether the observed distribution of the number of times each of the 49 numbers has come up fits with what would be expected with a truly random draw, and whether the gaps also correspond to what might be expected.
Submitted by david on Wed, 07/11/2007 - 3:59pm
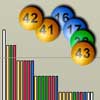 The UK National Lottery began on 19th November 1994 and there had been 1240 draws up to 20th October 2007. The jackpot prize is won by choosing in advance the 6 numbers that will be drawn from a set of balls numbered from 1 to 49. We can use the history of the lottery to illustrate many aspects of the theory of probability: how each draw is individually unpredictable, and yet the overall history shows predictable patterns; how a `league table' of numbers can be created that appears to show some numbers are preferentially drawn, and yet the table is completely spurious; how to test whether the balls are truly being drawn at random; how extremely unlikely events will occur if you wait long enough, and so on.
