Spotting a hoax using statistics
As of the 23rd May 2022 this website is archived and will receive no further updates.
understandinguncertainty.org was produced by the Winton programme for the public understanding of risk based in the Statistical Laboratory in the University of Cambridge. The aim was to help improve the way that uncertainty and risk are discussed in society, and show how probability and statistics can be both useful and entertaining.
Many of the animations were produced using Flash and will no longer work.
A report claiming that users of the Internet Explorer browser had lower IQs than users of other browsers has been revealed to be a hoax. I had been asked to comment on the report by BBC Technology and had got suspicious about the figures. The perpetrators of the hoax, which had received extensive coverage, have listed the reasons why they should have been detected, but did not include 'dubious statistics' in their list.
When I was asked to comment on this 'survey of 100,000 people', my immediate thought was that although a statistically significant difference in IQ between users of different browsers may have been found, the actual magnitude of any difference might be of negligible importance, as very large samples often lead to the phenomenon of 'statistically significant but not practically significant'.
I was therefore amazed to find the following graphic in the 'AptiQuant' report [link deleted as it now sends you to a marketing site].
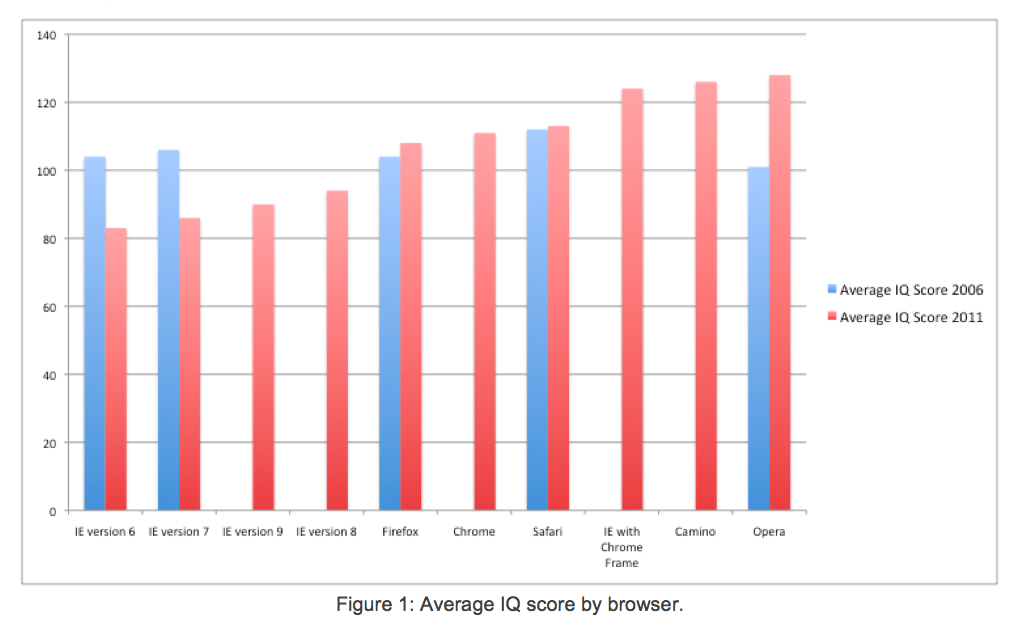
The average IQ of the IE6 users is around 80: this is around 1.33 standard deviations (15) from the mean (100), so that only around 9% of the population would get a score as low as this. 80 traditionally corresponds to the start of 'borderline deficiency' - for this to be an average for IE6 users they would have to be a very low-functioning group. The data is simply too extreme to be plausible.
Of course the important question is how a hoax survey from a hoax website could obtain huge international coverage without any checks on its provenance.
| Attachment | Size |
|---|---|
| 175.25 KB |
- david's blog
- Log in to post comments

Comments
Matthew Saltzman (not verified)
Sat, 06/08/2011 - 5:21pm
Permalink
Meanness
Here's a sketch of another way to get at the idea that the result is extreme.
If you took a fraction of the population starting from the left (lowest-IQ), what percentile would have a mean IQ of 80 (z-score -1.33)? If 80 is the 9th percentile, then the lowest 18% of the population would have a median score of 80. Because the scores at the right end are skewed left, the mean of 80 would correspond to a slightly higher percentile, maybe in the mid-20s?
But IE users account for about half the population (give or take 10%). If they were strictly the lowest half, the lowest possible median score would be around 90, and the lowest possible mean slightly lower.