Visualising uncertainty about the future
As of the 23rd May 2022 this website is archived and will receive no further updates.
understandinguncertainty.org was produced by the Winton programme for the public understanding of risk based in the Statistical Laboratory in the University of Cambridge. The aim was to help improve the way that uncertainty and risk are discussed in society, and show how probability and statistics can be both useful and entertaining.
Many of the animations were produced using Flash and will no longer work.
A great use of a 'spaghetti plot' of multiple model predictions for Hurricane Katia in this NBC news bulletin .
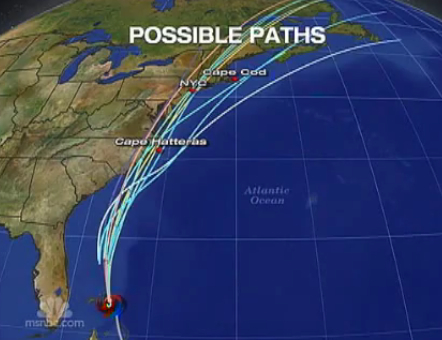
possible hurricane paths
This seems to nicely communicate essential unpredictability through the metaphor of 'multiple possible futures', even though what is being portrayed is between-model disagreement rather than within-model uncertainty.
We have just had a review paper published in Science called Visualising uncertainty about the future, although it primarily focuses on probability forecasts. although the Supporting Online Material is freely available (get in touch if you want a copy of the paper and can't get it through an institution). Also sadly, we did not include a spaghetti plot in our many examples - really should have but could not find a simple publicly available one until the week the paper was published.
You may access Visualising uncertainty about the future by following links from this web page.
- david's blog
- Log in to post comments

Comments
Joey
Tue, 13/09/2011 - 3:41am
Permalink
Interested in article
gmp26
Tue, 20/09/2011 - 9:45am
Permalink
Accessing the Science article
Links are now posted above. You must follow them from this page to avoid the paywall.