Chance Leagues
As of the 23rd May 2022 this website is archived and will receive no further updates.
understandinguncertainty.org was produced by the Winton programme for the public understanding of risk based in the Statistical Laboratory in the University of Cambridge. The aim was to help improve the way that uncertainty and risk are discussed in society, and show how probability and statistics can be both useful and entertaining.
Many of the animations were produced using Flash and will no longer work.
 Consider a league in which each team plays each other team exactly twice (both home and away) and the outcome of each match is determined randomly according to a fixed set of three probabilities of home wins, draws, and away wins that are independent of the match and the teams involved. What would the league table look like at the end of the season?
The animation below models this situation.
What does the animation represent?
The animation has a basic mode and an advanced mode, and you can switch between the two by clicking the button labelled either 'Basic settings' or 'Advanced settings'. The description below concerns the animation in basic mode. To learn about the advanced mode, click on the Help button within the animation.
The league
The league consists of $n$ teams (where $n$ is chosen by the user) and each team in this league plays each other team twice, both home and away. Three positive numbers $p_H$, $p_D$, and $p_A$, where $p_H+p_D+p_A=1$, are defined by the user. The outcome of each match in the league is determined randomly with a home win occurring with probability $p_H$, a draw with probability $p_D$, and an away win with probability $p_A$. Three points are gained by a winning team, one point is gained by a drawing team, and a losing team gains no points. After all the $n(n-1)$ matches have been played, the total number of accumulated points for each team is calculated.
The Settings tab
In this tab the user can specify values for the number $n$ of teams in the league, the probability $p_H$ of a home win, the probability $p_D$ of a draw, and the probability $p_A$ of an away win.
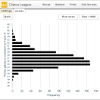
The Chart tab
Click on 'Run once' and the animation simulates a single season of a league and displays the points gained by each team. The team with the most points is labelled A, the team with the second most points is labelled B, and so forth. Click on 'Run ×1000' and the animation simulates 1000 separate leagues, and displays the average number of points for the top team in each of these 1000 seasons (labelled A), the average number of points for the second team in each of these 1000 seasons (labelled B), and so forth. Click on the $i$th bar in this display and a histogram of the frequency of the number of points gained by the team that finishes $i$th in each of the 1000 simulated leagues is shown.
See Football Leagues for an animation of the actual league tables of football teams from across Europe. See also European football - how much is chance?, Premier League, and One game to play! for more information on chance in leagues.
