Misleading conclusions from alcohol protection study
As of the 23rd May 2022 this website is archived and will receive no further updates.
understandinguncertainty.org was produced by the Winton programme for the public understanding of risk based in the Statistical Laboratory in the University of Cambridge. The aim was to help improve the way that uncertainty and risk are discussed in society, and show how probability and statistics can be both useful and entertaining.
Many of the animations were produced using Flash and will no longer work.
The Daily Mail today declared that "Drinking is only good for you if you are a woman over 65", while the Times trumpeted that "Alcohol has no health benefits after all".
But these headlines are without serious foundation, and through no fault of the journalists.
They are based on a paper in this week's British Medical Journal which uses data from the Health Survey of England to investigate the protective effect of low consumption of alcohol. Other studies that have suggested a protective effect have compared drinkers with non-drinkers, but the authors say the latter group will include former drinkers who may be in poorer health. So they use lifelong non-drinkers as their comparison group, and claim that "Compared with never drinkers, age stratified analyses suggest that beneficial dose-response relations between alcohol consumption and all cause mortality may be largely specific to women drinkers aged 65 years or more, with little to no protection present in other age-sex groups. "
But the authors’ conclusions are not backed up by the data. The figure below shows the observed hazard ratio (relative risk of dying each year) - curiously this graph did not appear in the published paper, but can be derived from the data provided in the tables.
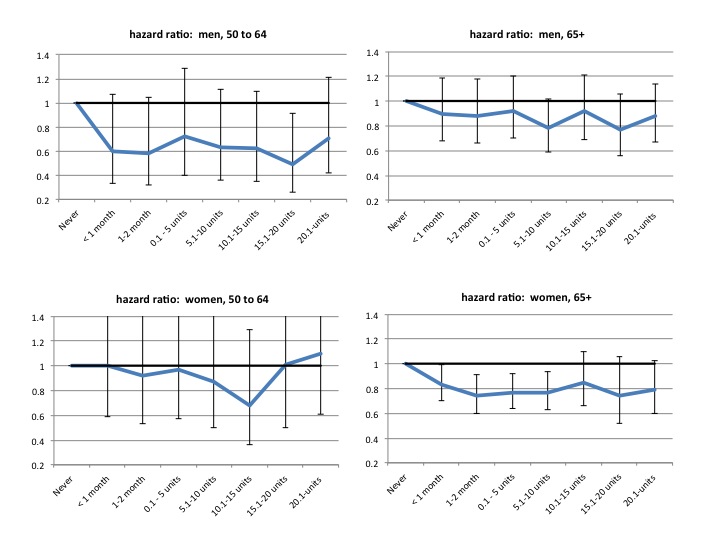
Hazard ratios in different age/sex groups, for different weekly alcohol consumption. Baseline group are 'never-drinkers'. Data from Health Survey for England.
The graphs suggest the following points:
- All groups consuming less than 20 units a week experienced lower mortality rates than the lifelong teetotalers.
- The confidence intervals are very wide. This is because there were few teetotalers and so not many deaths - for example the entire comparison for 50-64 year-olds is based on 17 deaths in the male baseline group, and 19 deaths in the females. This is completely inadequate to draw any firm conclusions, since there is large uncertainty about what the true underlying relative risks are.
- All the observed data are compatible with the kind of 10 to 20% protection that has been previously suggested.
- The 'significant' protective effects are implausibly large (greater than 20% reduction in risk). This is because in an underpowered study, only implausibly extreme observations can ever achieve 'significance'
- The authors have reported the few groups with 'significant effects' (ie where the interval excludes 1), and claimed the other groups showed 'little to no' effect. This is a classic statistical error, and produces very misleading conclusions, as even casual inspection of the graphs clearly shows.
So a more appropriate headline would have been "Study supports a moderate protective effect of alcohol".
In summary, the study is grossly underpowered to convincingly prove a plausible protection, and they have committed the cardinal sin of saying that non-significance is the same as 'no effect' in a study lacking sufficient events, in this case, deaths in non-drinkers. Maybe epidemiological studies should include power calculations, which make sure there is a reasonable chance of detecting a plausible effect, and which became standard in clinical trials after too-small studies were being used to claim that drugs did not work.
This is a poor use of statistics, and I am surprised it got past the referees and into the journal. A recent analysis showed that exaggerated health stories in the media were not generally the fault of the journalists, but the press releases they had been fed. Rather ironically, the analysis appeared in the British Medical Journal.
Technical note: Usually the way around this picking and choosing is to combine subgroups into a single comparison. But in this case grouping the consumption categories leads to almost no additional precision, since the width of the intervals is driven by the lack of deaths in the baseline group, which remains unchanged.
- david's blog
- Log in to post comments

Comments
Robc42
Fri, 08/01/2016 - 3:11pm
Permalink
hazard ratios for higher levels alcohol consumption