Is it possible to improve your chances of winning big in the National Lottery?
As of the 23rd May 2022 this website is archived and will receive no further updates.
understandinguncertainty.org was produced by the Winton programme for the public understanding of risk based in the Statistical Laboratory in the University of Cambridge. The aim was to help improve the way that uncertainty and risk are discussed in society, and show how probability and statistics can be both useful and entertaining.
Many of the animations were produced using Flash and will no longer work.
 This was the question I asked myself several years ago when making the decision to play the nation's favourite flutter on a regular basis. I couldn't improve the chances of my chosen numbers being selected but could I give myself a better chance of not sharing my winnings if my numbers were selected? The numbers which come out of the machine are random, but the numbers which people choose are not random (unless selected using the Lucky Dip option). If I couldn't play the machine, could I play the opponent?
Several academic papers have been written on this subject, and businesses have even been set up to sell information to players wanting to avoid sharing any winnings. Examples such as January 14th 1995 when 133 winners shared the £16 million jackpot and each won around £122,500 instead is clearly enough motivation for people to look into this.
Official statistics around the numbers selected for the National Lottery were released in the early days of the game, but are no longer published. However, one way to extract information around player preferences is by considering two subsets of all the Lottery draws which have taken place – those when there was a winner of the jackpot, and those when there was no winner.
Of the 1,759 Lottery draws between its launch on November 19th 1994 and October 31st 2012, there were 1,398 where there was a jackpot winner and 361 where there was no winner. I considered these subsets independently, looking at the frequency of the drawn numbers within both and how this compared with that expected by probability. I was careful to remove sampling bias introduced by the random nature of the draws. This would avoid for instance a scenario where a number which has been drawn far more than predicted across all draws appearing more than expected in either subset purely due to random selection bias.
If there truly is conscious selection at work, then we would expect an unpopular number to appear less than expected within the jackpot subset, and more than expected within the roll-over subset. This approach treats each number as an independent entity and does not take into account that numbers are selected within a group of six. Thus, a number coupled by chance to a popular or unpopular number could itself be considered as so. This effect should become less significant as the sample size increases however, and as will be seen, the results output by this approach are explainable and not immediately spurious.
When combining outputs of the analysis of the two subsets into one metric, it is clear to see that there is noticeable conscious selection taking place. The graphic below displays the 49 possible numbers against a popularity scale, the taller the columns the greater the popularity. The red dotted line is the frequency of occurrence expected by probability.
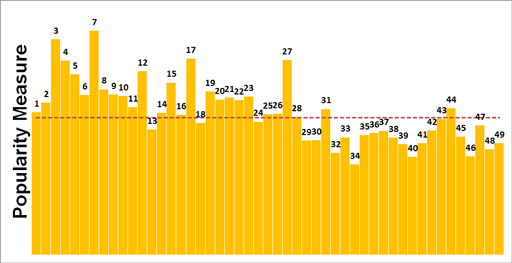
Popularity measure as column height
There are clear patterns worth pointing out:
- The oft-talked about 'birthday bias' is clear to see, where players use the birth dates of loved ones as a basis for number selection. We see in the graphic that smaller numbers are indeed far more popular than larger numbers.
- 31 however appears to be more popular than 29 and 30, despite the fact that it is less likely for a person to be born on the 31st of a month compared to the 29th and 30th . This may be due to the position of the numbers on the playslip.
- 13 is one of the most unpopular numbers within the 'birthday bias' region, which makes sense considering the cultural dislike of this number. Its neighbour 14 is also unpopular, perhaps due to it being skipped across along with 13 when the casual selector scans across the board from left to right.
- The most popular number is 7, with the second most popular being 3. This finding is aligned to common knowledge around the public's attraction to these numbers, within "choose a number between 1 and 10" questions for instance.
- There is also a clear popularity trend for lower numbers ending with a 7, namely 7, 17 and 27.
I have future plans to run further analysis to show how the geometry of the selection board also affects the popularity of numbers. I will also look to study the popularity of combinations of numbers.
Until then, to play the opponent it would be best to choose the numbers which are indicated as being unpopular (those with smaller columns in the graphic), to minimise the chance of another player having the same numbers. By publishing this analysis however, the effectiveness of the combination 32, 34, 39, 40, 46 and 48 has now been reduced! I would therefore suggest only dipping into this combination to avoid sharing a possible jackpot with the readership of the Understanding Uncertainty blog!
The author: Jonathan Clarke is a Doctor of Experimental Physics now working as a senior risk analyst specialising in building prediction algorithms. He has completed several 'home brew' analysis projects including predicting political voting preferences based on neighbourhood statistics.
- Log in to post comments

Comments
RationalLiberal
Sun, 11/11/2012 - 7:25am
Permalink
Can you post the numeric values?
Can you post the numeric values for your analysis results? I've already written a program to generate random numbers with weighted probabilities, but I'm currently using p(1-12) = 0; p(13-31) = 0.01; p(32-49)=0.045 (i.e. a simple avoidance of birthday numbers).
Also, do you have a similar analysis for the EuroLottery? Do our european neighbours have the same liking as us for 3,4, 7,12, 17, 27, etc?
kevin2kane
Sun, 11/11/2012 - 2:25pm
Permalink
I've implemented this for my lottery syndicate
Dr8Ball
Sun, 11/11/2012 - 6:52pm
Permalink
RationalLiberal:
RationalLiberal:
Thanks for the comment!
I could post them but it would be good to see if someone repeating the method gets the same numbers!
As for the EuroMillions, I have run the analysis but there's a bit more complexity in that one to deal with. For instance, a jackpot is matching all 5 numbers drawn from the main 50 and then the 2 numbers drawn from the Lucky Stars. So a jackpot win in this game incorporates conscious selection across two selection boards! Also, the Lucky Star selection board changed on May 10th 2011 with the number of possible balls increasing from 9 to 11. I've run the analysis on the pre-May 10th 2011 results, and get interpretable output for the Lucky Star selection board but not so much on the main selection board. I'm chalking this up to statistical noise due to the small sample size, but I need to look into it more.
Chochiana
Fri, 22/05/2015 - 5:30pm
Permalink
Hello, I have found your
Dr8Ball
Sun, 11/11/2012 - 7:09pm
Permalink
kevin2kane:
kevin2kane:
Thanks for the comment!
I've been running my numbers for a few years now, and keep having to check that my Direct Debit is still active such is my lack of success! I've added in a bit of randomness to one of my numbers, given that choosing your numbers by analysing the data is itself a form of conscious selection which could mean increasing your risk of sharing the prize with another number cruncher.
Does your analysis factor in any other elements (i.e. the number of winners are each prize point)?
Stathis
Wed, 19/06/2013 - 8:35am
Permalink
An easy way to be the one!
ShunReaken
Sat, 23/07/2016 - 1:42pm
Permalink
Raw data for player numbers popularity