Cardiac Disease Risk Calculators
As of the 23rd May 2022 this website is archived and will receive no further updates.
understandinguncertainty.org was produced by the Winton programme for the public understanding of risk based in the Statistical Laboratory in the University of Cambridge. The aim was to help improve the way that uncertainty and risk are discussed in society, and show how probability and statistics can be both useful and entertaining.
Many of the animations were produced using Flash and will no longer work.
A Risk Score
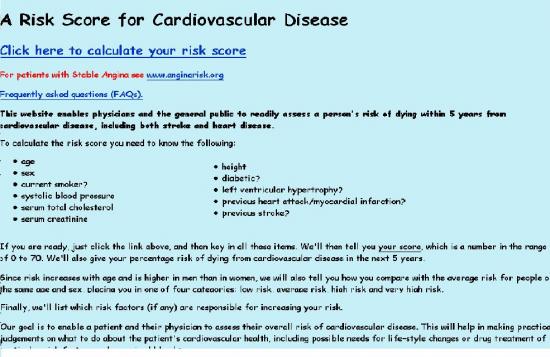
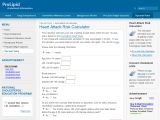
LSTM Cardiovascular Risk Score Calculator
Results: David’s predicted risk of death due to a cardiovascular cause in the next 5 years is 1.41%, which is compared to the average risk of 1.69% for a man of similar age. This calculator places him in the “average” risk category.
The predicted risk of death due to a cardiovascular cause in the next 5 years. It is meant to help doctors with their patients and thus a few technical questions are included, such as whether you've had ventricular hypertrophy before.
What evidence is used?
The score is derived from data on 47,088 men and women who participated in eight randomised controlled trials of drug treatment for high blood pressure in Europe and North America. Full details of the risk score and how it was derived are published in the British Medical Journal issue of 14 July 2001. The calculator was designed and implemented by Mike Bennett, London School of Hygiene & Tropical Medicine.
Evaluation
Though not as visually interesting as other risk calculators, it is trustworthy in its results. There are various contacts given for further questions, and reliable sources of information quoted.
Fun rating *
Science rating *****
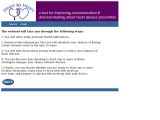
What is your risk?
![]()
Results: David’s heart disease risk is “very much below average” but not as low as the possible risk. Suggestions to lower his risk even more are given, such as eating more fish and nuts and decreasing his total cholesterol. To be very much below average means that he doesn’t have a many risk factors but they are careful to say it is just an estimate and does not mean he’ll never get heart disease.
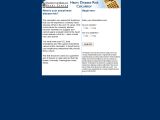
Disease Risk Index – Prostate Cancer
Results: David’s risk is below average. They’re suggestion for lowering that risk is to eat 5 servings of tomato-based foods a week.
By choosing one of 5 diseases (cancer, diabetes, stroke, osteoporosis, heart disease) a questionnaire is tailored to determine your risk of being affected by the chosen disease, on a scale of "low risk to high risk". The site was put together to promote healthy living.
What evidence is used?
A questionnaire gathers an individual’s health information. Another link labelled “How to estimate Risk” states, “Each question on the web site is related to a number that represents the strength of the association between the risk factor and the disease. As you answer the questions, the numbers are multiplied to equal your personal risk based on the risk factors that apply to you. Your risk is then compared to the average risk for a person your age and sex.” There are links to the full reports used to develop the Cancer Risk Index, upon which the rest of the tests are based, and full information on prevalence estimates for cancer.
Evaluation
Useful if you want general ideas for improving your health. If you want to find out more about how to calculate your risk of getting a disease other than cancer further investigations would be necessary.
Fun rating n/a
Science rating ****
Risk Charts - Heart UK

These are Cardiovascular Disease Risk Prediction Charts, estimating cardiovascular disease, stroke, etc. They are meant to help doctors with patients through lifestyle and medical treatment based on estimated levels of CVD risk.
What evidence is used?
The website states that "these estimates are not based on randomised trial evidence. These charts are based on groups of people with untreated levels of BP, total cholesterol and HDL cholesterol."
Evaluation
Knowledge of a few health terms is needed. They are not written for the general public.
Fun Rating n/a
Science rating ****
What is your Score?
Results: David’s point total was 6, indicating his 10 year CHD risk is 10%
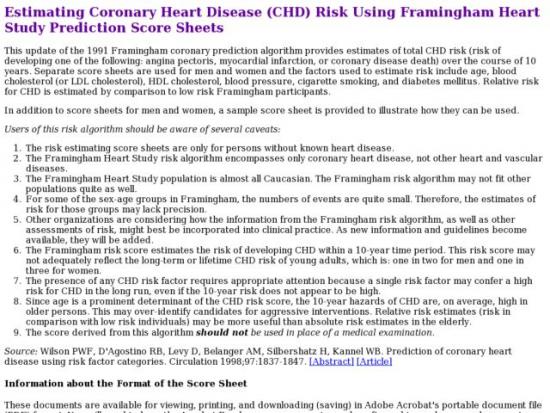
Coronary Disease Risk Prediction Score Sheet for Men based on LDL Cholesterol Level
Results: David’s point total was 5, indicating a 10 yr CHD Risk of 9%
What it calculates
You guessed it – it calculates your risk of coronary disease. It does this by a guiding you through 5 steps, each one assigning points based on your health and history (if you’re between the ages of 30-34 you have a -1, if you’re between the ages of 50-54, you add in 3 points).
What evidence is used
These score sheets are produced on the Framingham Study website and the research thoroughly explained and published widely. Most heart disease risk calculators will, in fact, be based on this same information.
Evaluation
The score sheets are simple and clear. They are not much fun, but when you are the definitive source, they may understandably be busy with other matters.
Fun rating n/a
Science rating *****
What is your Relative Risk?
Results: David’s results on a point system were 6, indicating a 10% risk of heart disease in 10 years.
What it calculates
Coronary heart disease risk. Interestingly, this calculator tallies up your points for an “average” 10-year risk, as well as your “low” 10-year risk.
What evidence is used
The Framingham Heart Study – Wilson, PW et. al. Prediction of Coronary Heart Disease Using Risk Factor Categories.
Evaluation
It’s easy to use and gives the user the option of calculating your score with incomplete values (if you don’t know your total cholesterol, for example).
Fun rating n/a
Science rating *****
Coronary Risk Assessment
Results: David’s risk of developing a heart attack or dying from an acute coronary event within the next 10 years is 5%, or 3.8% if the score is calculated by including sugar level.
What it calculates
Your risk of a heart attack within the next 10 years, with three different calculators.
What evidence is used
It is based on data of the PROCAM Study (The Prospective Cardiovascular Münster Study also
known as the Münster Heart Study). This study was initiated in 1978 by the Institute of Arteriosclerosis Research at the University of Münster. “In several waves of recruitment, more than 30.000 participants aged between 16 and 65 years were recruited from among the employees of 52 large companies and the public service in Münster and the northern Ruhr area. All participants are in continuing long term follow-up for heart disease, stroke and mortality.” The study results can be found linked to the website.
Evaluation
The website of the International Task Force for Prevention of Coronary Heart Disease is manageable and clear, despite having a wealth of information included. Considering the aim of the Task Force is “the diffusion at an international level of easily assimilable information on the prevention of coronary heart disease for physicians, medical professionals
and the public”, having three different risk calculators on their website makes it a good resource.
Fun rating n/a
Science rating *****
Heart Attack Risk
Results: David’s risk of getting a heart attack within the next 10 years is 9%. They point out that his two risk factors are hypertension and advanced age. The calculator states that David is in the medium-risk category and that for a man in his age groups with optimal risk factors, the risk is still 6%.
What it calculates
It estimates your risk of getting a heart attack within the next 10 years.
What evidence is used
Framingham Heart Study (link included to the study)
Evaluation
The simple website is set up by Crystal Lake Nutraceuticals, a dealer of dietary supplements, but does a good job of providing current medical views and study results in an engaging way. The calculator is a small part of the website but it is explained clearly with additional information for it.
Fun rating ***
Science rating *****
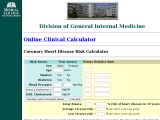
Heart to Heart
Results: David’s chances of having heart disease in the next 10years are 11%. They compare and state that a 54 year old male with no risk factors has a 7% average chance of having a heart disease sometime in the next 10 years.
What it calculates
It assesses your chances of heart disease in the next 10years.
What evidence is used
The website does not state clearly what the tool heart to Heart uses as evidence but does state it was developed at the University of North Carolina at Chapel Hill, Division of General Internal Medicine. Bios of the creators of the Heart to Heart Tool are included on the website -all medical professionals - and the CHAI Core (Communication for Health Applications and Interventions).
Evaluation
It would be interesting to know what data they are using, particularly since the percentage of heart disease is higher than other calculators for our test subject, David Spiegelhalter. They also provide a single-bar graph with results, stating that “according to most doctors” green mean a low chance and red a high chance of heart disease, which begs the question what doctors would read it differently?
Fun rating n/a
Science rating **
What is your actual Heart Disease Risk?
Results: David’s answers indicate his “actual risk of heart disease is 7%”. They go further to say “of 100 people who answered similarly, 7 are predicted to experience a major coronary heart event within the next 10 years.
What it calculates
It assesses the likelihood that you will experience coronary heart disease in the next 10 years.
What evidence is used
It is based on data derived from the Framingham Heart Study, Boston University.
Evaluation
Simple and straightforward. The website also offers links to other health calculators, for teen Marijuana Use, or Stress, for example.
Fun rating n/a
Science rating *****
My ESC?
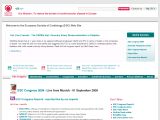
Results: David’s results could only be calculated with a systolic blood pressure of 150, not the actual 148 that it is, and a cholesterol level of 5.0 or 6.0, not the 5.8 it actually is. His “heartscore”, the 10 ten-year CVD risk, is not much affected by this, remaining at 4% with either.
HeartScore is aimed at supporting clinicians in optimizing individual cardiovascular risk reduction. It is the electronic and interactive version of the SCORE risk charts of the European Guidelines on CVD Prevention written by the 3rd Joint European Societies’ Task Force on Cardiovascular Disease Prevention in Clinical Practice.
What evidence is used
Put together by the European Society of Cardiology, whose mission is to reduce the burden of cardiovascular disease in Europe.The SCORE (Systematic Coronary Risk Evaluation) database combines results from 12 European cohort studies ,250,000 patients data collected, 3 million person-years of observation worth, and 7,000 fatal CV events recorded. The data is available through risk charts on the website and has been put forward by the Joint European Societies Task Force on CVD Prevention as the new standard in European SVD risk prediction and management.
Evaluation
The HeartScore tool requires sign up and intended for medical specialists. It provides both absolute and relative risk results. Professional and useful, saving patient data online, modifying as patient’s health improves etc. to give updated risks. Once signed-up, access to HeartScore TM is granted, found through a search option OR the sequence:Policy Initiatives > Prevention > Implementation Tools > Health Professionals>Score Risk Charts>HeartScore
Fun rating n/a
Science rating *****
Estimating your 10 Year CVD Risk
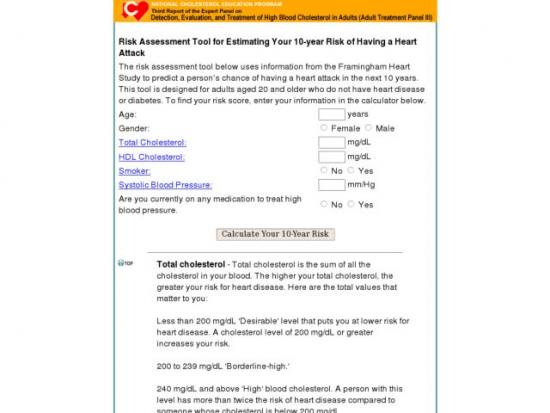
ATPIII Risk Assessment Tool for Estimating your 10-year Risk of Having a Heart Attack
Results: David’s chance of having a heart attack within the next 10 years is 8%.
What it calculates
A person’s chance of having a heart attack in the next 10 years.
What evidence is used
It is based on the Framingham Heart Study and produced through a Third Report of the Expert Panel on Detection, Evaluation, and Treatment of High Blood Cholesterol in Adults (Adult Treatment Panel III).
Evaluation
It seems that because it is produced by the National Cholesterol Education Program, there is additional information on healthier living. There is also basic information on what the terms within the calculator mean, such as what systolic blood pressure is.
