The numbers in "Tails you win: the science of chance"
As of the 23rd May 2022 this website is archived and will receive no further updates.
understandinguncertainty.org was produced by the Winton programme for the public understanding of risk based in the Statistical Laboratory in the University of Cambridge. The aim was to help improve the way that uncertainty and risk are discussed in society, and show how probability and statistics can be both useful and entertaining.
Many of the animations were produced using Flash and will no longer work.
Here are brief background notes and links for the numbers used in the "Tails You Win: the Science of Chance"
Warning: as it says in the programme, all probabilities are a matter of judgment. Therefore all the numbers given below are open to dispute, and certainly do not apply to each individual with their unique circumstances. They are intended to represent reasonable betting odds given the limited information provided.
-
Probability of falling in while punting: 0.005
Scudamore’s Punting Company estimate 750 – 850 hires per week during the busy season, with accidental immersions running at less than 0.5%. (personal communication)
-
Probability of a random Cambridge student winning a Nobel prize: 1 in 5000
65 Cambridge Graduates have won Nobel prizes.
They were students between around 1861 (Rayleigh) and 1972 (Tsien), say 100 years. Now, in each current year around 6500 new students are admitted (around 50% undergraduates).
100 years ago, it was around half that. So say there have been 320,000 new students over the 100 years. The proportion who won Nobel prizes is 65/320,000 = 0.02%, or 1 in 5,000. Of course we have to assume this past rate represents future probability, but I have no reason to believe to the contrary. -
Probability of a random Cambridge student not finishing their degree: 1 in 100
Degree completion in Cambridge is 99% , the highest in the country.
-
“on average each person in Britain has a 1 in a million daily chance of some kind of violent or accidental death?”
In 2010, out of a population of 55,000,000 in England Wales, 17,201 died of accidents and violence, known as External causes of morbidity and mortality. So that is 17,201 /55 = 313 micromorts a year, or around 1 a day.
-
“1 in a million is roughly the chance of flipping heads twenty times”
Each head has probability $\frac{1}{2}$, so 20 in a row is $\frac{1}{2}$ to the power 20, which is 1 in $2^{20} = 1,048,576$
-
“the likelihood of a major earthquake hitting the Bay area is something like 63% over the next thirty years.”
From Mary Lou Zoback. See the US Geological Survey's excellent earthquake information, including risk maps. -
“With two dice, and 36 possible combinations, there’s only one way to throw a 2. But you’re much more likely to get a seven.”
I need two 1’s to get a total of 2, with probability 1/6 x 1/6 = 1/36. But there are six ways to get a 7, and so the probability is 6/36 = 1/6. -
Chances of winning at roulette (American rules): Straight 37 – 1
A US roulette table has 2 zeros. So if I place $1 on a single number, there is one way to win and 37 ways to lose (35 other numbers and 2 zeros), all equally likely.Split: 18 – 1
If I place $1 on two adjacent numbers, there are 2 ways to win and 36 to lose.Street: 11.667 – 1
If I place $1 on three adjacent numbers, there are 3 ways to win and 35 to lose, which is 35/3 = 11 2/3 to 1 against.Red/Black: 1.111 – 1
If I place $1 on, say red,, there are 18 ways to win and 20 to lose, which is 20/18 = 10/9 = 1.11 to 1 against.“in Roulette the house advantage is 5.26 percent under American rules.”
If I place $1 on a single number there is probability of 1/38 that I end up with 36, and a 37/38 chance that I end up with nothing. The expected gain is therefore: 36/38 - 1 = −0.0526 (5.26% house edge) -
Margaret de Valois: Actuary, Mazars: 36, non-smoker. Her chance of living to 100 … 21.1%
This actuarial assessment takes into account assumed improvements in survival over the next 60 years. Life tables that do this are known as ‘cohort’ life-tables and come in different versions depending on whether a low, principle or high projection are made.
-
Logarithmic plot of Halley data
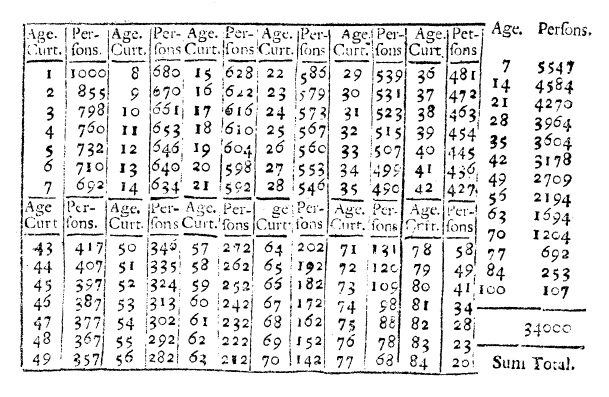
Copy of Halley’s original data -
“I was born in the 1950s and back then my expected lifespan was just 67 years.”
-
“The average lifespan is actually rising by 3 months a year”
See Social Trends 41 - Health “Between 1930 and 2009 period life expectancy at birth in the UK increased by around 20 years for both sexes”
-
“If I were born today, I could expect to live to 78.” .... “So at my age now, I can expect to live to …. 82”
The various statements about “expecting to lose ½ an hour” are based on the following procedure (see our Microlives page for a full description).
- Use epidemiological studies to estimate the annual excess risk for all-cause mortality (hazard ratio) associated with a life-long behaviour
- Translate the hazard ratios into changes in life-expectancy using the current life-tables for England and Wales
- Calculate the ratio (change in life-expectancy)/(number of days post 35 years old) obtain a pro-rata loss/gain associated with each day with a habit or behaviour post 35 years old.
An annual excess risk of around 9% (hazard ratio 1.09) translates to an approximate loss of ½ an hour each day past 35. Of course we cannot know or measure the precise effect of, say, smoking 2 cigarettes – the “1/2 hour” is a mathematical construct that averages over populations and lifetimes. We also cannot conclude that changes in behaviour will result in subsequent benefits.
-
“Research tells us that for every day you’re five kilos overweight – like I am – you can expect to lose half an hour off your life.”
A recent meta-analysis based on over 66,000 deaths estimated a hazard ratio of 1.29 for all-cause mortality per 5 kg/sqm increase in body mass index (BMI) over the optimum of 22.5 to 25 kg/sqm. For a man/woman of average height (1.75m/1.62m), this corresponds to a hazard ratio of around 1.09/1.10 per 5 kg overweight.
-
“Sad to say, if you’re a man sinking three pints a day then that’s also half an hour. “
In a recent meta-analysis of studies involving over 1,000,000 subjects and 94,000 deaths, one drink (10g of alcohol) per day was associated with an adjusted hazard ratio of around 0.83 for men. Each successive daily drink was associated with a hazard ratio of around 1.06, up to 6 drinks a day. The protective effect of alcohol on all-cause mortality is controversial due to the possibility of residual confounding and ex-drinkers having stopped due to ill-health: Di Castelnuovo and colleagues consider a cautious hazard ratio for low consumption is 0.9, which we have assumed. This for a man, 3 pints of low-strength beer (3.5%) per day, containing around 6 UK units (48g of alcohol), would be associated with a hazard ratio of around 0.9 x 1.06 x 1.06 x 1.06 x 1.06 = 1.13, corresponding to around ½ hour each day loss in life-expectancy.
-
“A regular run of half an hour' and you can expect to live longer – half an hour longer.”
We assume this regular exercise is on top of being reasonably active. A meta-analysis of 22 studies and over 52,000 deaths estimated an adjusted all-cause hazard ratio of 0.81 for 2.5 hours per week (20 minutes a day) of moderate exercise compared to no activity. There were strong diminishing marginal returns, with 7 hours a week associated with a hazard ratio of 0.76, or 0.76/0.81 = 0.94 when compared to 2.5 hours a week. So the extra ½ hour a day of exercise was associated with slightly less than ½ hour average gain in life expectancy.
Also, in a study of over 400,000 people in Taiwan, an extra 15 minutes of activity each day was associated with a hazard reduction of 4%, so ½ hour was associated with a hazard ario of 0.92, corresponding to around ½ hour gain in life-expectancy.
These results are for ‘moderate exercise’, and so the ‘run’ is more of the ‘brisk walk’ variety.
-
“Two cigarettes costs half an hour.”
Doll and Peto estimated a Standardised Mortality Ratio of 2.17 for smoking 15-24 cigarettes per day. If we assume a hazard ratio of 2.2 for 20 cigarettes, and a constant effect of each cigarette on the risk, then pro-rata this translates to a hazard ratio of 1.08 per 2 cigarettes, which translates to 1/2 a day loss of life-expectancy.
-
“I’m 58 now. As the years roll by, in more and more of these possible futures I die, until by the age of 82 about half of my future selves will be dead and about half still alive”
Numbers surviving derived from 2010 Interim Life Tables for England and Wales
For smokers, a hazard ratio of 2 is assumed.
-
Weekend ski trip – 3 micromorts
Downhill skiing in the Alps has an estimated average daily risk of 1.1 micromorts. We assume a long weekend.
-
Scuba-dive – 5 micromorts
British Sub-Aqua Club report
“the fatality rate for BSAC members is 0.54 fatalities per 100,000 dives” (it is twice as high for non-members) -
Marathon run – 7 micromorts
A US study reports 26 cardiac deaths in 3, 292, 268 marathons.
-
“There’s only about a 7 in a million chance of death. 7 micromorts.”
The US Parachuting Association reports 21 deaths in 3,000,000 jumps in 2010.
The British Parachuting Association
reports an average of around 10 micromorts a jump for trained parachutists, but only 3 micromorts for a tandem jump (based on 1 fatality in 380,000 jumps). My judgement was around 7. -
“That’s the equivalent of riding about forty miles on a motorbike.”
Around 7 miles on a motorbike per micromort in the UK in 2010.
-
Being 18 – 500 micromorts
Annual hazard from all causes for an 18-year old.
2010 Interim Life Tables for England and WalesBeing 58 – 7000 micromorts
Annual hazard from all causes for a 58-year old. 2010 Interim Life Tables for England and Wales -
Chance of each Premium Bond today winning a prize … 24,000-1
-
“A perfect sequence of five numbers – there should be 50 of these in the book.”
Th first number must be 1,2,3,4,5 (prob 1/2). Each subsequent number has 1/10 chance of being correct. So expected number of sequences of $5$ numbers is
$$ 1,000,000 \times \frac{1}{2} \times \frac{1}{10} \times \frac{1}{10} \times \frac{1}{10} \times \frac{1}{10} = 50$$
“And the same number five times in a row, there should be about 100 of those.”
The expected number of runs of length $n$ out of $N$ digits between 0 and 9 is
$$ E[R_n|N] = N \times \left(\frac{1}{10} \right)^{n-1} $$
If we assume $N=1,000,000$ and $n=5$, then the expected numbers of runs of 5 identical digits occurring in the book is
$$ 1,000,000 \times \left(\frac{1}{10} \right)^{4} = 100$$
“You can even expect somewhere in a million random numbers, the same number to occur seven times in a row”
If we assume $N=1,000,000$ and $n=7$, then the expected numbers of runs of 7 identical digits occurring in the book is$$ 1,000,000 \times \left(\frac{1}{10} \right)^{6} = 1,$$
-
“taking all the results together, the totals match the shape of randomness remarkably well.”
At each draw, a number has a 6/49 chance of being picked. The number of times each number occurs after N draws therefore has a Binomial distribution with mean 6/79 N and variance N 6/49 43/49. A normal approximation to this distribution can be applied to the histogram of the counts.
-
“There’s only a 1 in 14 million chance of me winning the jackpot. “
See standard calculations for lottery odds“There’s only a 1 in 56 chance of me getting the smallest prize of £10.”
-
“Overall the lottery only pays back 45% of the money it takes in. “
-
“a family having three children all with the same birthday, born in different years, but all their three children being born on the same birthday. Wow what are the chances of that?
We assume no family planning, and no February 29th births, and so babies essentially pop out at random, equally likely to be born on one of 365 days. The important thing is that the first birthday is irrelevant - it can be anything. But the next 2 must be on the same day as the first, and this occurs with probability 1/365 x 1/365 = 1 in 135,000. See our web page on this.
-
“Since there’s a million families in this country with three children...
There are 24,000,000 households in Great Britain, and 1,000,000 of them are made up of a couple and 3 or more dependent children [Social Trends 37, page 14, 2007].
-
An hour watching TV: LOSE 15 MINUTES OF YOUR LIFE!
Based on 1270 deaths, the EPIC Norfolk study reported a hazard ratio of 1.04 per hour of television per day, adjusted for other lifestyle factors including overall activity, corresponding to 1/4 hour off your life-expectancy for each 1 hour watching TV.
.
| Attachment | Size |
|---|---|
| 140.88 KB |
- Log in to post comments
