Skill or Chance in the Indian Premier League
As of the 23rd May 2022 this website is archived and will receive no further updates.
understandinguncertainty.org was produced by the Winton programme for the public understanding of risk based in the Statistical Laboratory in the University of Cambridge. The aim was to help improve the way that uncertainty and risk are discussed in society, and show how probability and statistics can be both useful and entertaining.
Many of the animations were produced using Flash and will no longer work.
by Pelham Barton
 Do the results in the 2009 Indian Premier League Table (20-over cricket) show more variation between the teams than one would expect if the results of single matches were completely random?
The Indian Premier League is a competition in 20-over cricket (the shortest form of the regular professional game) played between eight teams representing various Indian cities. The design of the league was for each team to play each other home and away in a league of 14 matches per team, with the top four teams then taking part in semi-finals and a final. In 2009 the tournament was moved at fairly short notice to South Africa. Teams did not have specific "home" grounds but the full programme of 59 matches was still scheduled.
Weather permitting, each match produces a winner. There is a concept of a tied match in cricket, equivalent to a draw in football, but the nature of the scoring makes this very rare. It happened once in the 2009 tournament, and the competition rules provide for a tie-break, so this match still produced a winner. If a match is partly interrupted by bad weather, rules are in place to ensure that a winner is still found whenever possible. If there is severe disruption from the weather, there is no room in the schedule for the match to be replayed, and the match is left with no result. In 2009 this happened twice in the league matches. In each case no play took place at all.
The winner of each league match is awarded two points, with one point to each team in the case of no result. The total points scored by the teams in 2009 were 20, 17, 16, 14, 14, 13, 11, 7. Much has been written about what went right and wrong for the various teams taking part in the tournament. Not much thought appears to have been given to the question of how much variation in the teams' results would be expected on the basis of chance alone.
I set up a computer application to assign results at random to each of the 56 league matches. For each match I gave a probability of 2 in 56 of a no result (the empirical value from this season) and otherwise gave each team an equal chance of winning. I then got the computer to calculate the maximum number of points obtained by a single team from such a simulated season.
Repeating this process 1,000,000 times (just a few minutes on a laptop) gave the distribution of highest scores shown in Figure 1. Sampling error is negligible compared to the size of the bars. Odd numbers are less likely than even numbers because they would require the “winning” team to have been involved in an abandoned match.
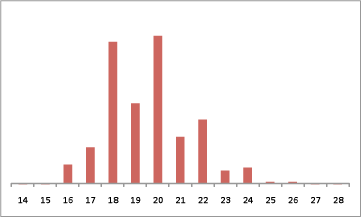
Figure 1. Simulated distribution of highest team total points for a competition the size of the Indian Premier League with random results.
The actual results had Delhi topping the table with 20 points, exactly the most likely (mode) and median value from the random results.
The "maximum team points" is a somewhat crude statistic. It is better to use a test statistic that reflects the full variation between all eight teams in the table. Recognised measures for this are the standard deviation or its square, the variance. Because a fixed total number of points is awarded, a test based on the sum of the squares of the teams' points is equivalent to a test based on standard deviation or variance. The sum of squares can be any even number within the appropriate range. In Figure 2, the distribution is shown in groups of 10, so that the bar marked 1580 represents the range 1576 to 1584 (inclusive). It is not clear what is causing the “dip” at 1640, but this was maintained when the number of replications was increased by a further factor of 10.
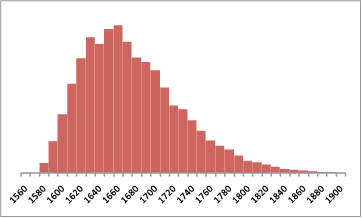
Figure 2. Simulated distribution of sum of squares of team total points for a competition the size of the Indian Premier League with random results
The actual sum of the squares of the teams' points was 1676. This figure was equalled or exceeded in 44.5 percent of my simulations.
I conclude that the variation between the teams in the group table is completely within the range that would be expected if the results were determined solely by chance.
About the Author

Pelham Barton
Pelham Barton has been interested in cricket for as long as he can remember. With no playing ability, he has pursued an interest in the statistics of the game and joined the Association of Cricket Statisticians in 1977. In his day job, he is currently a Senior Lecturer in Mathematical Modelling in the Health Economics Unit at the University of Birmingham.
- Log in to post comments

Comments
Pelham.Barton
Wed, 21/04/2010 - 1:02pm
Permalink
2010 Update
Anonymous (not verified)
Thu, 28/10/2010 - 9:24am
Permalink
skill or chance