Chance in football
As of the 23rd May 2022 this website is archived and will receive no further updates.
understandinguncertainty.org was produced by the Winton programme for the public understanding of risk based in the Statistical Laboratory in the University of Cambridge. The aim was to help improve the way that uncertainty and risk are discussed in society, and show how probability and statistics can be both useful and entertaining.
Many of the animations were produced using Flash and will no longer work.
To coincide with the kick off of the football Premier League 2009–2010 we have updated our articles on the role of chance in football, and we have updated our animation to include leagues from across Europe over the past twenty years.
The final table for the Premier League 2008–2009 season is shown below.
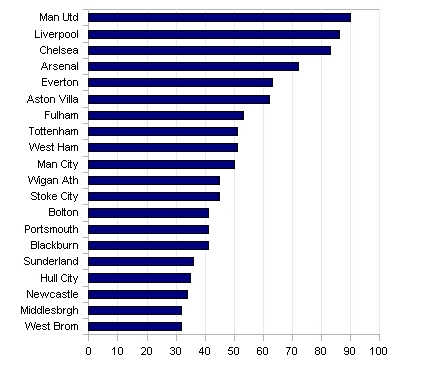
Premier League table 2008–2009
In total 380 matches were played, 173 of which were home wins, 110 were away wins, and the remaining 97 were drawn. What would the league table look like if the outcome of each match was determined randomly, with a 173/380 (45.5%) chance of a home win, a 110/380 (29%) chance of an away win, and a 97/380 (25.5%) chance of a draw? In a series of articles, beginning with European football – how much is chance?, we contrast actual results with results that would arise from chance alone to measure variation in ability in football leagues.
- horace's blog
- Log in to post comments
