Understanding public reporting of mortality outcomes after congenital heart surgery
INTRODUCTION
Each year in the UK, approximately seven thousand children are born with a heart defect (congenital heart disease). Congenital heart disease covers a wide range of disorders from relatively minor (such as a small hole in the heart) to more severe conditions where a child’s heart cannot function without medical intervention. About half of all children born with a heart defect will need heart surgery at some stage in their childhood. However, these operations are technically challenging to perform, and sometimes surgery carries substantial risks. Complex surgical procedures on extremely small hearts are among the most technically challenging and resource-intensive in modern medicine. Understandably, patients, families, health professionals, and society in general are concerned to know that the outcomes of these procedures are being properly monitored, sometimes called quality assurance.
Survival to 30 days after heart surgery in children has been improving steadily over the last 20 years and now over 97% of children survive to at least one month after surgery. However, the risk of a poor outcome after surgery is very different for different heart defects and is also affected by other factors such as the age of the child and other health problems the child may also have. So when monitoring outcomes for hospitals we need to be sure we are taking into account how risky the procedures they are performing are as well as we can.
Since 2000, all UK specialist hospitals have contributed data on all procedures performed in children to the National Congenital Heart Disease Audit (NCHDA), one of the national audits managed by the National Institute of Cardiovascular Outcomes Research (NICOR). Each child’s survival status is independently obtained from the Office of National Statistics (ONS) and NICOR has published hospital-specific survival outcomes for individual procedure categories online since 2007. Since 2013, NICOR has also published annual reports of survival outcomes across all operations performed on children with heart disease within each specialist hospital.
To monitor outcomes as fairly as possible, NICOR uses statistical methods to see whether outcomes from each hospital are in line with “what we would predict” after taking into account how risky the procedures were. So while monitoring outcomes by counting survivors in different centres seems straightforward, unfortunately it is not that simple (whether in congenital audit or elsewhere).
We want to help people explore what the published audit data actually means and how we can use the results.
TABLE HEADING
Below is a table of the results published by NICOR for 2010-2013. For completeness and to aid interpretation, we have added some extra columns to the published table.
FIGURE HEADING
The graph shows a summary of how each specialist hospital’s actual 30-day survival rate over 2010-2013 compared to the predicted survival. This graph matches that published by NICOR. Please see explanations below and FAQs to interpret this graph.
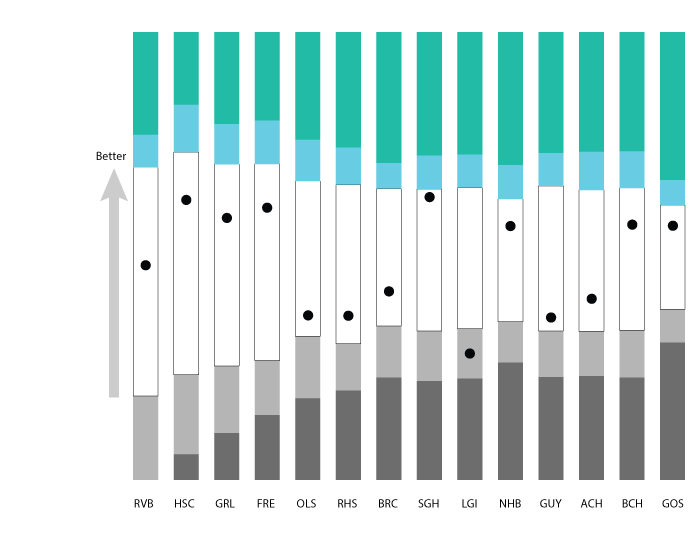
TABLE + FIGURE HEADING
This shows the table combined with the graph – the graph has been flipped on its side to show the same information next to the relevant information for each hospital