Could a 'safest' option on sat navs save lives?
As of the 23rd May 2022 this website is archived and will receive no further updates.
understandinguncertainty.org was produced by the Winton programme for the public understanding of risk based in the Statistical Laboratory in the University of Cambridge. The aim was to help improve the way that uncertainty and risk are discussed in society, and show how probability and statistics can be both useful and entertaining.
Many of the animations were produced using Flash and will no longer work.

Since the start of our relationship my partner and I disagreed about the best way to travel the approximately hour long journey between our homes on either side of the peak district. She preferred the well lit M60 and M62 route, feeling that it is considerably safer. I preferred the Woodhead pass, the quicker route which winds its way over the hills, and was after all suggested by Google Maps.
While I knew motorways were safer, I felt that she was being overly cautious. So I set about trying to work out just how different the two routes were in terms of safety.
Using data on the number of fatalities and the traffic volume of each road class (Department for Transport, Statistics, 2013a) I could produce the following table (Table 1).
Table 1. The probability of death per mile on the different classes of roads in Great Britain in 2012 (the most recent year that this data is available), in terms of micromorts (1 in 1,000,000 chance of death). These values represent the risk for car occupants only.
|
Road Class |
Micromorts Per Mile |
|---|---|
|
Motorways |
0.00098 |
|
Urban A Roads |
0.00184 |
|
Other Urban Roads |
0.00179 |
|
Rural A Roads |
0.00564 |
|
Other Rural Roads |
0.00624 |
|
All Road |
0.00333 |
This table gives us a fairly low resolution map of the safety of the roads in Great Britain(1).
By looking at how far I travelled on each road class during the two routes, I could then calculate the difference in the number of micromorts per trip (Table 2).
Table 2. A comparison of two routes between W. Yorkshire and Cheshire. A route suggested by Google Maps via the Woodhead Pass, and a route via the M60 and M62. With the distance travelled on each road class and the number of micromorts incurred on each route.
|
Route |
Distance Travelled (miles) |
Time (minutes) |
Micromorts |
|||||
|---|---|---|---|---|---|---|---|---|
|
Motorway |
Urban A Roads |
Other Urban Roads |
Rural A Roads |
Other Rural Roads |
Total |
|||
|
Suggested |
0.0 |
0.0 |
0.0 |
25.2 |
7.9 |
33.1 |
64 |
0.192 |
|
Motorway |
35.0 |
0.0 |
0.0 |
16.0 |
0.0 |
51.0 |
71 |
0.125 |
With a micromort incursion of 0.192, the suggested route is 54% more dangerous than the motorway route, which has a micromort incursion of 0.125; this means I could reduce my risk of death by 35% by taking the motorway. Clearly Google has been trying to kill me, and more annoyingly my partner was right.
Google does not appear to have an option for choosing the safest route, and as far as I am aware, neither do other “route planners” such as in-car satellite navigation devices.
So now I would like to know the answer to a slightly more significant question:
How many deaths could be avoided if route planners sent car drivers on the safest routes possible?
A simple equation for estimating this can be represented like this:
N=D×R×J
Where:
$N$ = Number of avoidable deaths
$D$ = Total number of car occupant deaths
$R$ = Average reduction in risk if the safest route is taken instead of the route suggested
$J$ = Proportion of miles travelled on suggested routes
In 2012 $D$ was 801.
Estimating $R$ and $J$ appears to be pretty difficult, good data regarding either is hard to come by, but we can at least try.
The 35% decrease in risk I calculated on my journey is probably not representative of the potential risk savings on all journeys. One problem with finding a good estimate for $R$ is the distribution of journey distances (Department for Transport, Statistics, 2013b). There are far more journeys at the bottom end of the journey length distribution, but these journeys make up a small proportion of the overall miles travelled (and presumably risk incurred) (Figure 1.).
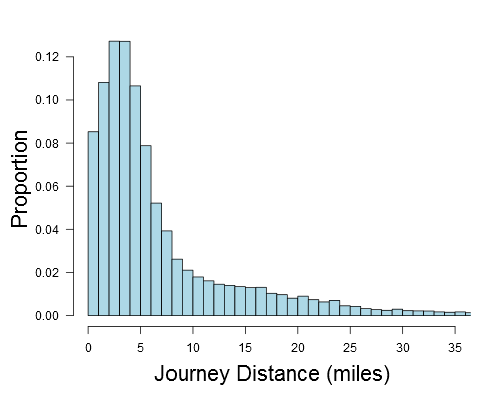
Figure 1. Journey length distribution for UK car journeys during 2012. Estimated from National Travel Survey grouped data. The x-axis of this graph is truncated.
The shortest 55% of journeys (those under 5 miles) account for only 15% of the miles travelled. At the other end of the distribution, the longest 10% of journeys (those over 20 miles) account for over 50% of the miles travelled.
With this in mind I produced 50 sample journey lengths by taking a representative sample from this distribution. For each distance in the sample I found a random postcode (Random Postcode Generator) for the starting point and made the destination, the given distance away in a random direction. I could then compare the route suggested by Google for each of these journeys to a route that appeared safer (usually based on less time spent on rural roads or more time spent on motorways(2)). The percentage reduction in risk between the suggested and safest route could then be calculated for each journey, as I did in Table 2. Weighted by journey distance, this resulted in an estimated average risk saving of 11.5% across the whole distribution.
11.5% is therefore the average reduction in the risk that an individual would be subjected to while travelling by car, provided they always travelled by the safest route instead of the suggested route.
This is somewhat of an oversimplification however. The shorter journeys were often impossible to improve on in terms of safety and could usually only be made slightly safer compared to longer journeys. A simple model based on the sample journey data predicts that the longer a journey is, the greater the potential safety savings. Using this model and assuming that route planners are used on the longest journeys from the distribution, the sensitivity of the percentage of avoidable car deaths to route planner use was estimated (Figure 2, solid line). The dashed line in Figure 2 assumes that the journeys involving route planners are found uniformly across the journey length distribution. The true sensitivity is probably somewhere between these two lines.
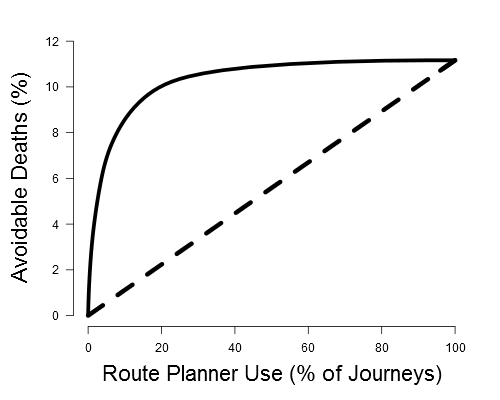
Figure 2. The sensitivity of the expected percent of avoidable car deaths due to route planner use.
Solid Line: Assumes that the journeys on which the route planners in question are used come from the given percentage of journeys at the long end of the journey length distribution.
Dashed Line: Assumes that the journeys on which the route planners in question are used are representative of the journey length distribution.
We can see that due to the journey length distribution above, estimating $J$ alone is not enough. In order to make a sensible estimation of the avoidable deaths we need to know how the journeys on which individuals travel using a route planner are distributed. There is some research which confirms the assumption that sat navs are used on longer journeys, and also that people who drive further overall, are more likely to use a sat nav (SWOV, 2010). But this is not enough.
In the absence of specific data, I found an estimate of sat nav use in 2008 (Transport Direct, 2009) and assumed that the rate of use amongst owners was at the same level in 2012. This resulted in an estimated sat nav use of 35% of journeys. At 35% route planner use, assuming they are used on the 35% longest journeys (solid line in Fig. 2) the potential percentage of avoidable deaths would be about 11% of car deaths. Based on these estimates:
An estimated 88 car occupant deaths per year could be avoided by the use of a 'safest' option on sat navs.
There is clearly a lot of uncertainty here however, the calculation of both the route planner use and the sensitivity of the avoidable deaths to route planner use are based on several assumptions.
By excluding the uncertainty that derives from trying to look at only journeys that use route planners already, we can make a broader claim with more confidence, asking instead:
How many car occupant deaths could be avoided if all car drivers travelled the safest routes to their destinations?
A bit of an ask perhaps but, what if every driver considered safety for every trip? We could simply use the average calculated across the whole journey length distribution - 11.5%.
An estimated 92 car occupant deaths per year could be avoided if all car drivers travelled the safest routes.
This may in fact be an underestimate, since route planner users appear to travel more safely to their destinations than non-route planner users. The change from traditionally worked out routes (with maps and signage) to suggested routes, results in significant reduction in journey time and distance (SWOV, 2010). This potential risk reduction could be added to the risk reduction from travelling the safest routes if we are imagining 100% route planner use.
From a public health perspective we could also consider the risk to pedestrians that cars produce. This changes the micromorts for each road type and changes the total number of deaths to 1075. This would give us an estimate of the total number of avoidable death if all U.K. car drivers travelled the safest routes to their destinations.
An estimated 124 deaths (car occupants and pedestrians) per year could be avoided if all car drivers travelled the safest routes.
There would of course be costs to safer routes. The loss of time and the increased cost of fuel (bringing with it environmental costs) which the safer journeys would bring, have not been considered here. There may also be diminishing returns as more people are sent down the safer roads, or greater congestion as people cram onto motorways and urban roads. Although these costs would presumably be at least partially counteracted by reduced medical intervention and insurance costs, not to mention the personal suffering that results from a serious traffic accident. In practice, these factors should probably be included in any route judgement. In principle at least, I've established that there may be many deaths that could be avoided by the presence and use of a “safest” option on route planners such as sat navs and Google Maps.
Footnotes
- In reality some roads may be over 10 times more dangerous than the average for their road class. (Road Safety Foundation, 2010). Data on risks of specific roads would be even more powerful for comparing the risks of various route options.
- An intelligently designed routing algorithm would almost certainly be much better at picking the safest route than me. Safety reduction estimates are therefore somewhat conservative.
References
- Department for Transport, Statistics, 2013a, Table RAS30018 - Reported casualty and accident rates by urban and rural roads, road class, road user type, severity and pedestrian involvement, Great Britain, latest available year.
- Department for Transport, Statistics, 2013b, National Travel Survey, 2012, Statistical Release.
- Road Safety Foundation, 2010, Identifying the network on which Britain’s road deaths are concentrated EuroRAP 2010 Results.
- Random Postcode Generator, http://www.doogal.co.uk/PostcodeGenerator.php
- SWOV, 2010, SWOV Fact Sheet - Safety effects of navigation systems.
- Transport Direct, 2009, Satellite Navigation Research - Final Report.
- Log in to post comments

Comments
Perhaps
Thu, 10/07/2014 - 2:20pm
Permalink
The dangerous route still saves 5 minutes
TobyJ
Sun, 20/07/2014 - 5:39am
Permalink
Thanks for the reply.
Thanks for the reply. You are right that in practice an excessive focus on one type of risk can be counterproductive. The health and environmental impacts of fossil fuel burning cars are absolutely factors that should be considered, as you mention. It is important to emphasise that I focussed exclusively on one type of risk, but that in reality you should want to compare all costs and benefits (within reason) including time and pollution. The problem of focusing too much on time, when there may well be significant costs in other areas, is what I have attempted to highlight by focussing instead on the risk of death from a crash.
The high health risk from pollution that you mention is very interesting, and might warrant a heavy weight in favour of routes that produce the fewest emissions, in an ideal scenario. As with safety, the route that produces least emissions is not always going to be the quickest, so the suggested routes may be similarly sub-optimal compared to those that take emissions into account.
I am also not sure it is completely fair to compare 'time spent driving' to 'time spent dead', though I like the way that you've highlighted the trade-off. In practice you would also have to include 'time spent disabled by an accident', 'time spent in hospital' etc.
Perhaps
Tue, 29/07/2014 - 2:10pm
Permalink
Comparing qualities of time
Dave Marsay
Sun, 14/06/2015 - 11:26am
Permalink
My pedantry