Another tragic cluster - but how surprised should we be?
As of the 23rd May 2022 this website is archived and will receive no further updates.
understandinguncertainty.org was produced by the Winton programme for the public understanding of risk based in the Statistical Laboratory in the University of Cambridge. The aim was to help improve the way that uncertainty and risk are discussed in society, and show how probability and statistics can be both useful and entertaining.
Many of the animations were produced using Flash and will no longer work.
Sadly another passenger plane crashed yesterday - the third in 8 days, the Air Algerie flight on July 24th, the TransAsia flight in Taiwan on July 23rd, and Malaysian Airlines in Ukraine on July 17th. Does this mean that flying is becoming more dangerous and we should keep off planes? The following analysis may appear cold-hearted, but is not intended to diminish the impact of this tragic loss on the people and families involved.
The Plane Crash Info website contains the summaries of these three accidents - this site makes powerful reading and is not for those with a fear of flying. Their Statistics page is full of useful information, including a graph showing a clear decline in the rate of accidents over the last 40 years: the 9/11 events in 2001 do not even make a blip in the graph.
However, it shows that flying can still carry some danger. 91 commercial flights containing 18 or more passengers have crashed in the previous 10 years (2004 to 2013), a rate of one every 40 days on average. So how surprising is it that 3 should happen in a space of 8 days?
A similar question was asked last November, when 6 cyclists were killed in London over 2 weeks, and Jody Aberdein and I wrote a paper on this: the methods are explained here. We can apply the same ideas to the 'cluster' of plane crashes, although of course this analysis is rather simplistic and ignores the undoubted variation in risk when flying in different parts of the world.
Consider any window of 8 days. If planes crash in an entirely unpredictable way at a rate of 91 over 10 years (3650 days), then we would expect 8 * 91/3650 = 0.2 crashes in any particular 8-day window. So assuming a Poisson distribution, the chance of at least 3 crashes in an 8-day window is around 1 in 1000 - very small indeed. So it is very surprising that there would be 3 or more crashes between July 17th and July 25th 2014.
But this is not the right question to ask. We should be concerned with whether such a 'cluster' is surprising over some period, say 10 years. In 10 years there are 456 non-over-lapping 'windows' of 8 days, and the chance that at least one of these contains at least 3 crashes = 1 - the chance that that none of them has at least three crashes = 1 - 0.999^456 = 0.41 (without rounding). And the more complex 'scan-statistic' adjustment, that allows for a sliding rather than non-overlapping windows, puts this chance up to 0.59.
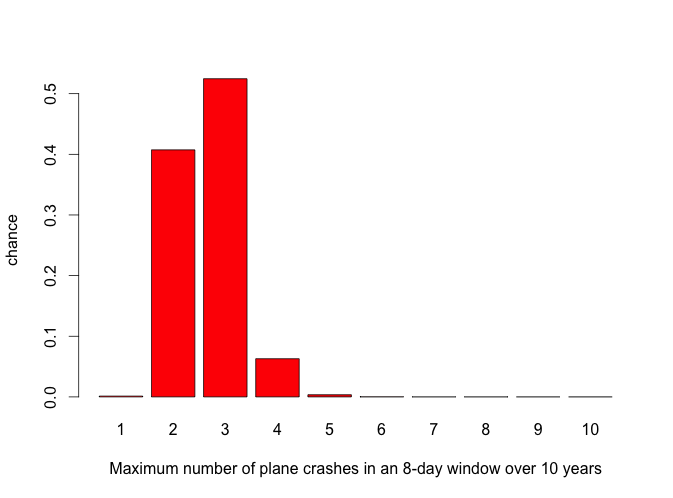
So there is around a 6 in 10 chance that we should see such a large cluster over a 10-year period. In fact, as the graph below shows, the most likely maximum number of crashes of commercial planes with over 18 passengers in any 8-day window over 10 years is exactly ..... 3.
It is difficult to know how to interpret this - our emotions are rightly influenced by the awful nature of these events and the suffering they have caused. But personally, I hope it will make me no more nervous about flying than I am at the moment (and I have to admit I am not that keen to start with).
[Edit 10.02 July 25th: I had initially stated the adjusted probability stayed at 0.41: on checking the code I realised it changed to 0.59]
- david's blog
- Log in to post comments

Comments
Perhaps
Sat, 02/08/2014 - 2:20am
Permalink
The meaning of 'such'
"So there is around a 6 in 10 chance that we should see such a large cluster over a 10-year period."
In this sentence, one has to be aware of the meaning of 'such'. Does 'such' mean 'in at most 8 days' or does it mean 'at least 3 accidents'?
The article focuses on the interval of 8 days and gives the probability that there are at least 3 accidents (i.e. 'such' means 'at least 3 accidents' and the length of the interval is not random, but fix (8 days)).
One could also approach the question from the other side, where the interval is random and the number of accidents is fix. If we look for the shortest interval with three accidents, we even get slightly more than a 3 in 4 chance (>75%) that this interval is at most 8 days. My only assumptions were that all 91 accidents should be uniform on the 10-year period and iid. R does the rest:
day <- NULL
for (k in 1:10000){
x <- runif(91)
xsort <- sort(x)
xp <- c(0,0,xsort)
xm <- c(xsort,0,0)
xd <- xm-xp
z <- min(xd[3:91])
day[k] <- z*3650 }
sum(day<8)
P.S.: I would rather say there is a 3 in 4 chance (instead of 6 in 10) that we should see such a large cluster over a 10-year period. I think it is more obvious to fix the discrete number of accidents instead of the continuous interval. But that's really personal preference.
Perhaps
Sun, 03/08/2014 - 3:21pm
Permalink
What is random? (Part II)
My last comment points out that we can consider different things to be random. In the article by Prof. Spiegelhalter, a Poisson distribution was assumed for the number of accidents within an interval (8 days). Then, the random number of accidents within this constant (i.e. non-random!) interval was considered.
I mentioned that one could also make an approach with a non-random number of accidents (3 accidents) and a random interval. However, my calculation actually does something different. In contrast to Prof. Spiegelhalter, who assumed a Poisson distribution for the (random) number of accidents, I considered the number of accidents in the 10-year period to be 91, so non-random. (It's a matter of fact that there were really 91 accidents and not 91±19 [Pois(91)]!) My calculation approaches the question: ''Is it surprising that we have seen a cluster of '3 accidents within 8 days' in the past 10 years, where 91 accidents took place?'' The answer is no, since we expect in 76% of the 10-year periods, where 91 uniformly iid distributed accidents take place, that we see a cluster of ''at least 3 accidents in at most 8 days''.
By the way: Using my approach, the histogram in the article would be replaced by a histogram with probability 0.0% that we only find a cluster of 1 accident in any 8 day window, 24.1% that the maximal cluster size is 2 (in the article, this probability is ~41%), 67.5% that it is 3 (~53% in the article), 8.0% that it is 4 (~6%), 0.4% that it is 5, 0.0% that it is 6 or higher (for 6, I get 0.015%, for 1,7 and higher all my iterations gave exactly 0, so <0.005%; uncertainty of the given probabilities is 0.3% or less (95% confidence), e.g. (67.5±0.3)%).
shood1943
Sat, 30/05/2015 - 12:25am
Permalink
RE: Plan crashes
shood1943
Sat, 30/05/2015 - 12:27am
Permalink
Plane Crashes