Using expected frequencies when teaching probability
As of the 23rd May 2022 this website is archived and will receive no further updates.
understandinguncertainty.org was produced by the Winton programme for the public understanding of risk based in the Statistical Laboratory in the University of Cambridge. The aim was to help improve the way that uncertainty and risk are discussed in society, and show how probability and statistics can be both useful and entertaining.
Many of the animations were produced using Flash and will no longer work.
The July 2014 Mathematics Programmes of Study: Key Stage 4 (GCSE) specifies under Probability
{calculate and interpret conditional probabilities through representation using expected frequencies with two-way tables, tree diagrams and Venn diagrams}.
- the brackets and bold case means this comes under additional mathematical content to be taught to more highly attaining pupils.
The use of the term ‘expected frequencies’ is novel and not widely known in mathematics education. The basic idea is very simple: instead of saying “the probability of X is 0.20 (or 20%)”, we would say “out of 100 situations like this, we would expect X to occur 20 times”.
‘Is that all?’ I hear you cry. But this simple re-expression can have a deep impact. The idea is strongly based on research in risk communication, in particular the work of Gerd Gigerenzer and others who use the term ‘natural frequencies’. Extensive research (see selected references at the bottom) have shown this representation can prevent confusion and make probability calculations easier and more intuitive.
The first point is that it helps clarify what the probability means. When we hear the phrase ‘the probability it will rain tomorrow is 30%’, what do we mean? That it will rain 30% of the time? Over 30% of the area? In fact it means that out of 100 such computer forecasts, we can expect it to rain after 30 of them. By clearly stating what the ‘denominator’ is, ambiguity is avoided. It has been shown that by using expected frequencies, people find it easier to carry out non-intuitive conditional probability calculations.
Expected frequency is the standard format taught to medical students for risk communication, and is used extensively in public dialogue. Examples include the QRISK program and the current leaflets for breast cancer screening.
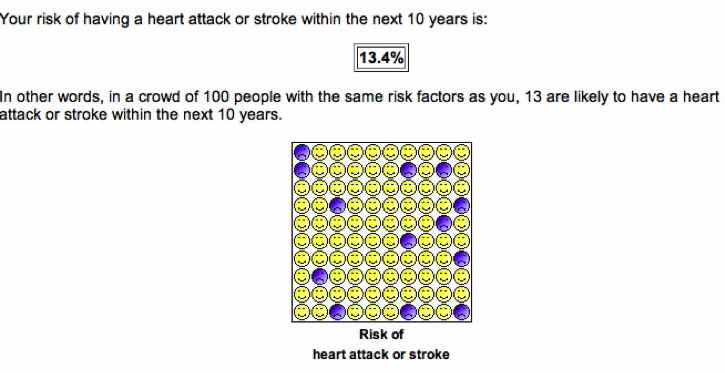
Output from the QRISK program using expected frequencies – the most widely used tool in general practice for assessing and communicating cardiovascular risk
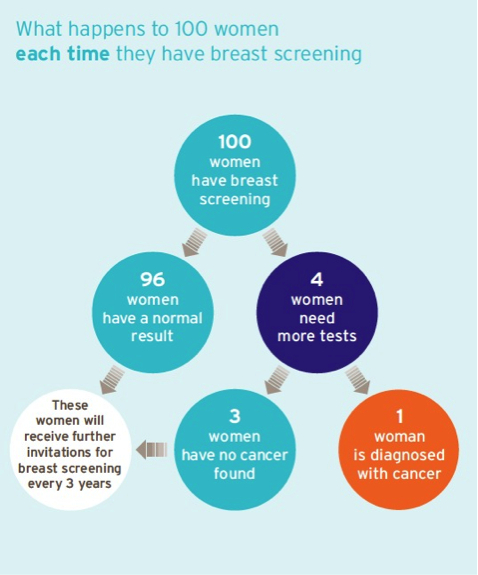
An image from the current breast screening information leaflet from the NHS Screening Programme, showing the use of expected frequencies to communicate the chances of different events subsequent to a mammogram
In teaching probability, expected frequencies can be used in their own right, or as a tool for doing more complex probability calculations. Perhaps the ideal representation is using ‘icon arrays’, as in the QRISK example, but these cannot be drawn by students and are inappropriate for small probabilities. Therefore tree representations are appropriate, although as noted in the Programme of Study, two-way tables and Venn diagrams can also be used and will be illustrated below . They can be introduced gradually, possibly using the framework shown below, in which some sample questions and a fewe solutions are provided.
1. Basic probability.
This is essentially a one level tree. Questions can involve going either from probabilities (expressed as decimals, fractions and %’s) to expected frequencies, or vice versa. The problems can be drawn as either expected frequency or probability trees, as shown for the following questions. The actual questions could be provided in different ways, for example with some entries in a tree provided and the student asked to complete the tree.
Going from probability to expected frequency
- Some balanced dice have probability 1/6 of coming up ‘4’. Out of 60 throws, how many ‘4’s would we expect to come up?
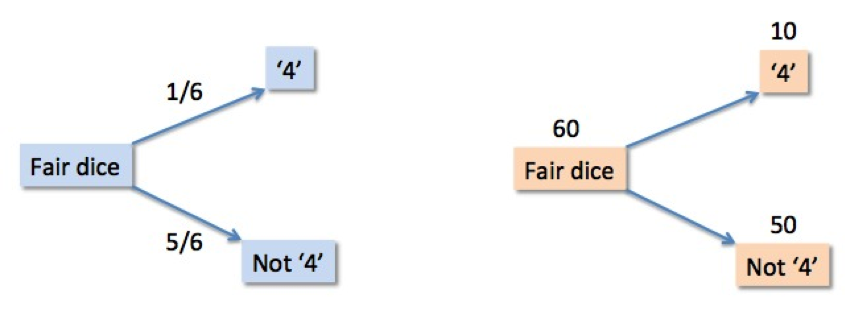
Probability and frequency trees for dice
.
- 80% of the school students can roll their tongues. If I pick 1000 students at random, how many do you expect will NOT be able to roll their tongues?
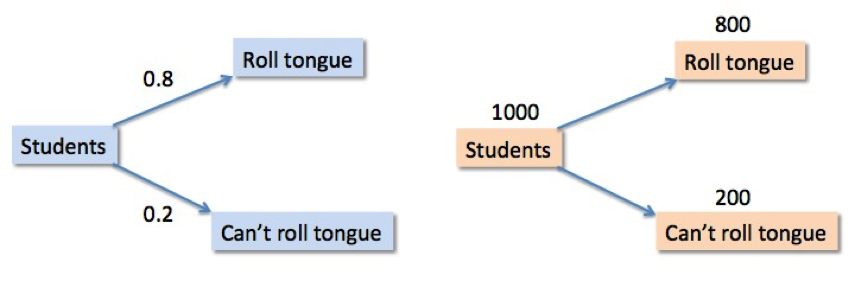
Equivalent probability and frequency trees for tongue-rolling
.
- There is a 0.02 probability of winning some prize with a National Lottery ticket. If I buy a ticket a week for a year, about how many winning tickets do I expect to get?
- A doctor tells your uncle he has a 15% chance of a heart attack in the next 10 years. Out of 100 men like your uncle, how many would you expect to have a heart attack in the next 10 years?
Going from expected frequencies to probabilities.
In this case we need to make clear that a single case is representative of group.
- In Dumpsville, in past years it has typically rained on 6 days in June (which has 30 days). Assuming the climate has not changed, if I plan to visit Dumpsville next June, what is the probability the day will be dry?
- Experience has shown out of every 100 racing cyclists, 20 will have been doping. If I pick a cyclist at random, what is the probability that he will be ‘clean’ (not doping)?
- In a typical school with 80 Year 10 students, 64 of them will have a profile on the social media site Face-ache. What is the probability that if we pick a Year 10 student at random, they will not have a profile?
2. Comparisons of probabilities.
This involves comparison of two different situations, and can be represented using a pair of trees. It is ideal for dealing with challenging and realistic questions concerning relative and absolute risks.
Probabilities to expected frequencies
- If I buy a ticket in Super Lottery, there is a 1% chance of winning something, while a ticket in the Duper Lottery has a 3% chance of winning a prize. If I intend to buy 100 tickets, how many more times will I win if I buy Duper tickets rather than Super tickets?
- A newspaper headline says that eating radishes doubles your chance of getting Smith’s Disease. 1% of people who don’t eat radishes get Smith’s Disease anyway.
- Out of 200 people not eating radishes, how many would I expect to get Smith’s disease?
- Out of 200 people eating radishes, how many would I expect to get Smith’s disease?
- How many people have to eat radishes, in order to get one extra case of Smith’s disease?
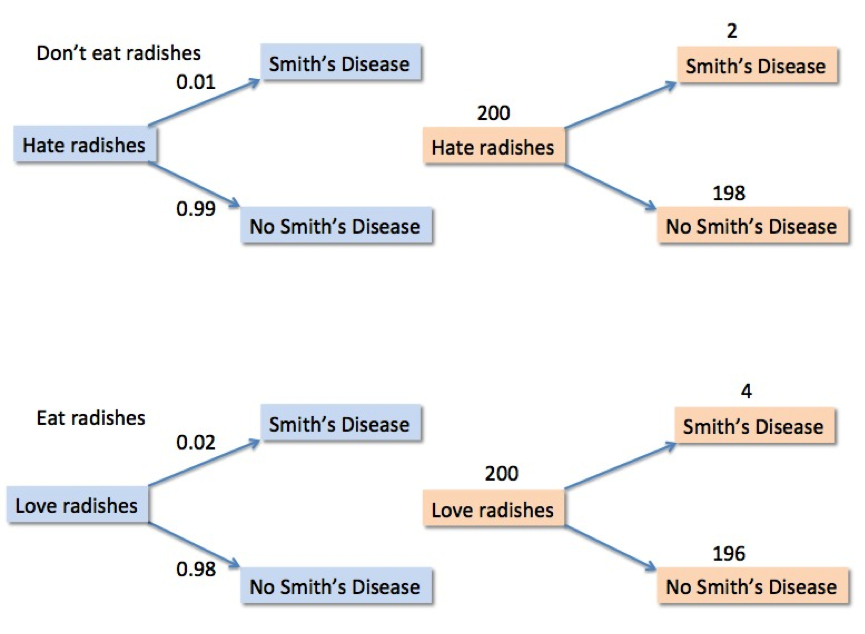
Probability and expected frequency trees for people who eat and do not eat radishes
Expected frequencies to probabilities
- Typically it rains on 6 days in June (30 days). I am told that in September there is double the chance of raining on any day. What is the chance that it will rain on a random day in September?
3. Conditional and marginal probabilities.
This requires two-level trees, and can also bring in two-way tables and Venn diagrams. First, give the conditional probabilities, set up the expected frequency tree, then can calculate the marginal expected frequencies and convert back to probabilities if wanted.
-
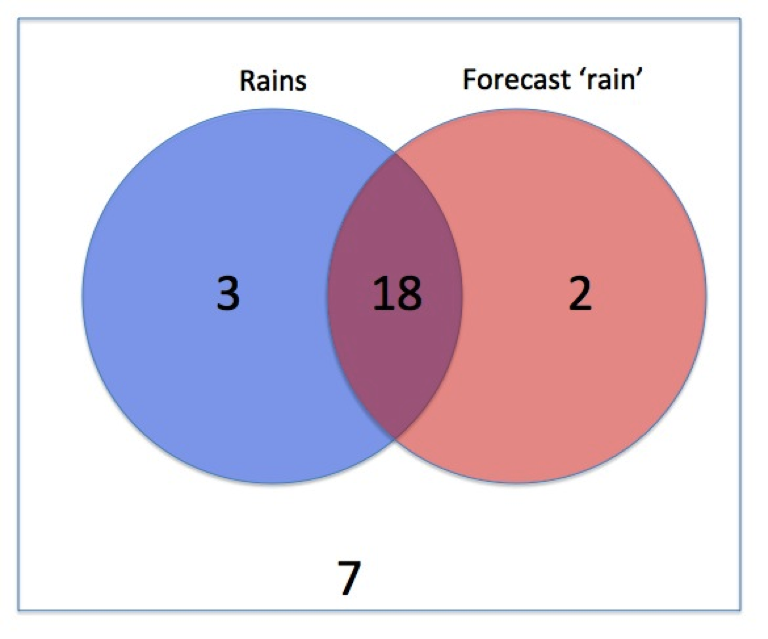
A weather forecast is generally right. When it forecasts ‘rain’, 90% of the time it rains. When it forecasts ‘no rain’, 70% of the time it does not rain. In a typical September they forecast rain on two-thirds days and no rain on one-third of days.
- How many days would you expect it to rain each September?
- What is the probability that a random day in September is not rainy?
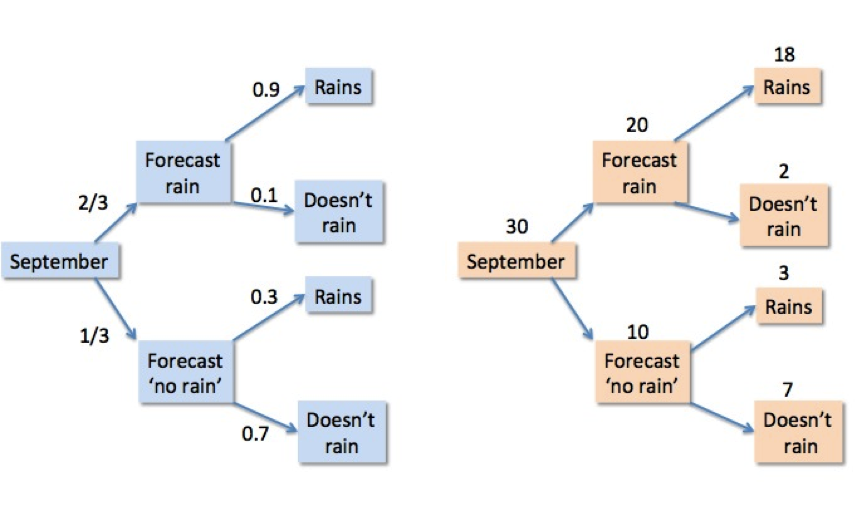
Probability and expected frequency trees for forecasting rain
From the expected frequency tree, we expect it to rain on a total of 18+3=21 days in September, and not rain in 9. So the probability that a random day in September is not rainy is 9/30 = 0.3.
To get this result directly from the probabilities is not straightforward.
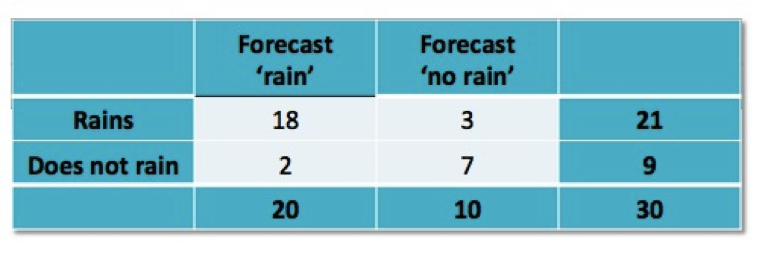
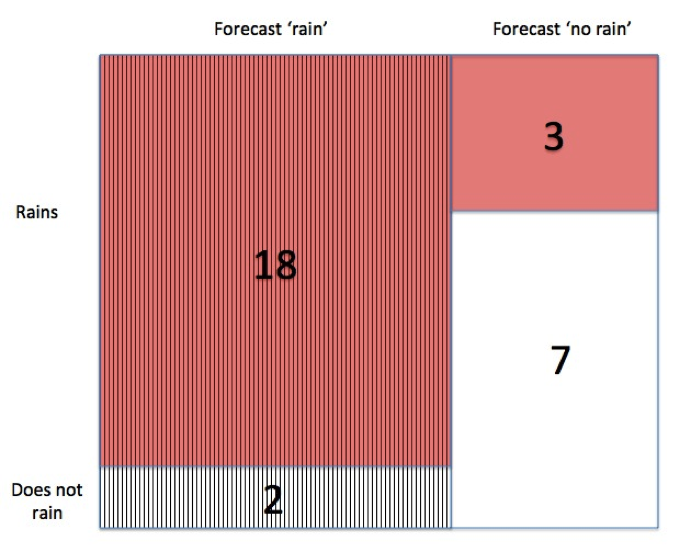
We can also represent the expected frequencies as a two-way table or a Venn diagram.
- A fair coin is flipped to decide whether your cricket team is going to bat first or second – heads you bat first, tails you bat second. If you bat first, your team wins 80% of the time. If you bat second, you win 50% of the time.
- Out of 100 games, how many do you bat first in?
- Out of 100 games, how many do you bat first, and then win?
- Out of 100 games, how many do you win?
- Before you flip the coin, what is the probability of you winning the game?
- 100 students are suspected of cheating in an exam. They are wired up to a lie detector that will go ping! If it thinks you are lying. The people who make the detector claim that, if you are lying, there is a 90% chance the machine will go ping!. If you are genuinely not lying, there is a 10% chance the machine will get it wrong and go ping! Suppose 10 of the students have really been cheating. For how many students will the machine go ping!?
4. Inverse probabilities.
This is where things can get a bit tricky, but using expected frequency representations allows students to tackle some of the classic non-intuitive probability problems – essentially Bayes theorem. If they can do these, they have learnt a subtle and valuable skill.
- Weather forecasting: of the times it rains, what proportion did the forecast get it right?
-
- It rains 21 times, and in 18 the rain was forecast, so the proportion is 18/21 = 6/7: i.e. when it rains, there is 6/7 chance that the rain was forecast. Try doing that without using expected frequencies!!! Alternatively this is straightforward to read off the two-way table.
- Cricket: of the times you win your match, what proportion did you bat first?
- Lie detector question – what is the chance, if the machine goes ‘ping!’, that the suspect has been cheating?
5. Using frequencies when teaching probability.
This is outlined by Jenny Gage and myself in our NRich materials, and in this paper. The picture below shows part of the process of generating a two-way table by combining events represented by coloured bricks. From these empirical frequency distributions it is straightforward to go to expected frequency distributions, and hence to probabilities, using the process outlined above.
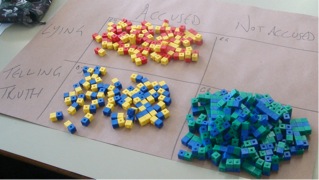
Results of experiments in which joint events are represented by pairs of coloured bricks
Using pairs of bricks to represent joint events: these can then be arranged as a two-way table, as above, or as a frequency tree.
Additional resources:
NRich materials
http://nrich.maths.org/probability
Jenny Gage paper at 1th ICME
http://nrich.maths.org/content/id/9887/Gage,2012_ICME12.pdf
Angela Fagerlin, Brian J. Zikmund-Fisher and Peter A. Ubel, Helping Patients Decide: Ten Steps to Better Risk Communication
http://jnci.oxfordjournals.org/content/103/19/1436.full.pdf+html
Kurz-Milcke, E., Gigerenzer, G., & Martignon, L. (2008). Transparency in risk
communication: Graphical and analog tools. Annals of the New York Academy of
Sciences, 1128, 18–28.
http://library.mpib-berlin.mpg.de/ft/ek/EK_Transparency_2008.pdf
Gigerenzer, G., & Hoffrage, U. (1995). How to Improve Bayesian Reasoning Without Instruction: Frequency Formats. Psychological Review, 102(4), 684-704.
http://library.mpib-berlin.mpg.de/ft/gg/GG_How_1995.pdf
Gigerenzer, G., Gaissmaier, W., Kurz-Milcke, E., Schwartz, L. M., & Woloshin, S. (2007). Helping doctors and patients make sense of health statistics. Psychological science in the public interest, 8(2), 53-96.
http://www.psychologicalscience.org/journals/pspi/pspi_8_2_article.pdf
Use of natural frequencies and frequency trees in modern health communication – breast cancer screening leaflets
http://www.cancerscreening.nhs.uk/breastscreen/publications/ia-02.html
- david's blog
- Log in to post comments

Comments
NTWest
Tue, 03/02/2015 - 7:48pm
Permalink
Probability != Relative Frequency
Probability is not relative frequency (and it is not always a number)! Teaching people this is the worst thing we have done for many years. It may be the case that the relative frequency of *similar* events approaches the probability (given the existing evidence) of a specific event. All probability is conditioned on evidence, not determined by a magical series of events stretching off into infinity. Kids would be better served learning about logic and the logic of probability than in pretending that the only way to find the probability of something is to stretch it out to the second coming.
Keynes explains this beautifully in chapter 8 of his "A Treatise of Probability": http://www.gutenberg.org/files/32625/32625-pdf.pdf
See here for an excellent explanation of probability (and why you can use frequency to help inform probability, but understand that they aren't the same).
http://wmbriggs.com/post/15030
Some questions that cannot be answered if Probability is relative frequency:
What is the probability that the sun will go supernova tomorrow?
What is the probability that the New England Patriots will win the 2016 super bowl?
What is the probability that Mt. Vesuvius will blow in the next 5 years?
All of these questions require that you find some evidence, some might be relative frequencies, but others will be "Tom Brady will be the quarterback" or "the magma pressure has increased significantly and other volcanoes with similar pressure have blown in a year", etc.