A visualisation of the information in NHS Breast Cancer Screening leaflet
As of the 23rd May 2022 this website is archived and will receive no further updates.
understandinguncertainty.org was produced by the Winton programme for the public understanding of risk based in the Statistical Laboratory in the University of Cambridge. The aim was to help improve the way that uncertainty and risk are discussed in society, and show how probability and statistics can be both useful and entertaining.
Many of the animations were produced using Flash and will no longer work.
The current NHS Breast Screening leaflet contains some fairly complex information which can be summarised using the graphic below.
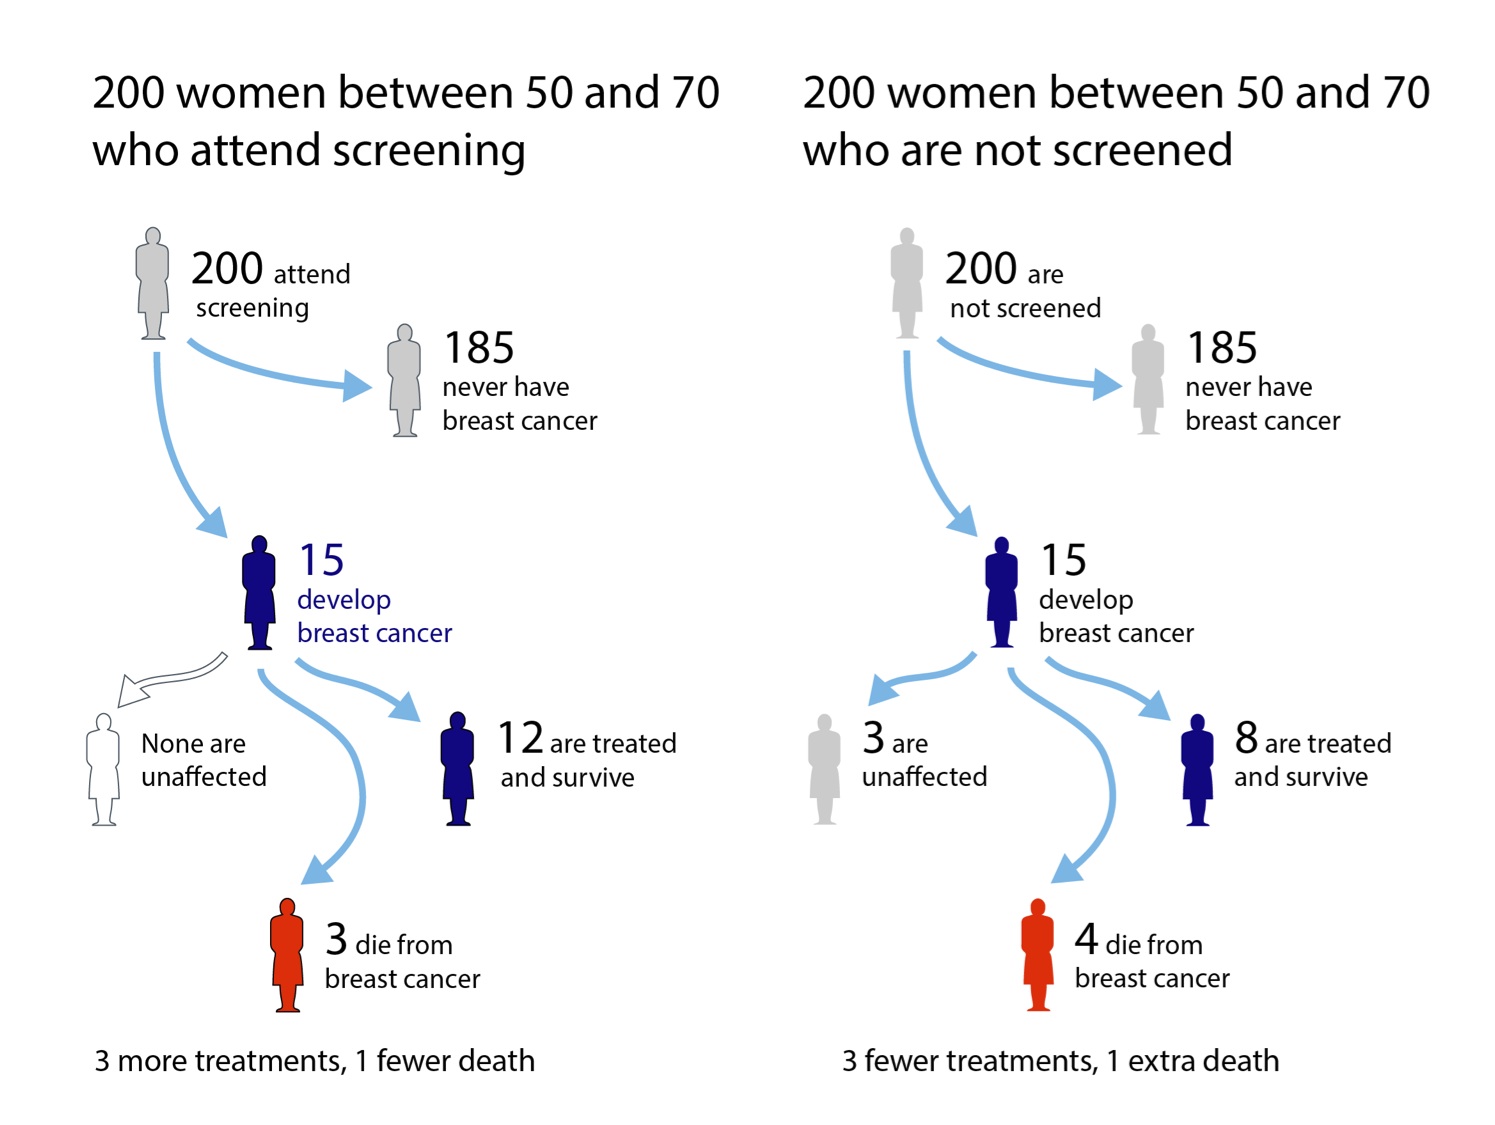
What might be expected to happen to 200 women who either do or do not attend breast screening every three years between ages 50 and 70, and then are followed up until aged 80. Graphic by Mike Pearson, from information in NHS Screening leaflet.
Essentially, the leaflet says that 15 out of 200 women would be expected to get breast cancer over these 20 years and, if screened, all will be treated but 3 would be expected to die early from their breast cancer. If, however, 200 similar women had chosen not to be screened, we would expect the same number of breast cancers, of which 4 would be expected to die early. But 3 women with breast cancer would have a form that would not trouble them – they would never be diagnosed and treated.
In summary, for every one of the survivors who ‘owes her life’ to screening, 3 other women would never have been bothered by their cancer if they had not gone to screening – these are ‘over-treated’ cases. Recent coverage of breast screening has noted this possibility of over-diagnosis and over-treatment: the leaflet states that each year the screening programme saves 1,300 lives, but a cost of 4,000 women offered treatment they do not need.
I don’t think it is an exaggeration to consider that these leaflets comprise a revolution in presenting patients with balanced information so that they can make an informed choice – indeed the leaflets do not explicitly recommend attending screening (although they are accompanied by a letter making an appointment for screening, which might be considered a very strong ‘nudge’). The leaflet is also upfront that these numbers are not the absolute truth, saying “numbers .. are the best estimates from a group of experts who have reviewed the evidence’.
Conflict of interest: I was part of the panel that drew up the leaflets - an excellent process which is described in this publication.
Opinionated footnote: an ‘information paradox’
The visualisation is an ‘expected frequency tree’, a form which has been shown to be effective in transparently communicating the potential harms and benefits of medical interventions. It was liked by the women taking part in the ‘Citizen’s Jury’ set up to help design the leaflets, but a similar graphic was removed from the leaflet at a final draft – a focus group found it difficult to understand.
I felt this was unfortunate. In fact I consider there is a paradox in action. Health information leaflets are designed for those with a reading age of 11, and similar levels of numeracy. But there is some reasonable evidence that people of low reading age and numeracy are less likely to take advantage of options for informed choice and shared decision making. So we are left with the conclusion -
Health information leaflets are designed for people who do not want to read the leaflets.
That's the paradox. It is, of course, everyone’s right not to engage with informed choice, but it also seems reasonable that those who want good information are provided with it in as clear a way as possible. The solution, of course, is to recognise that ‘one size does not fit all’, and provide material at multiple levels of sophistication. This is easier on a web-site, and the Breakthrough Breast Cancer explanation of breast screening has a nice hierarchical structure including an alternative representation of this information.
But even with paper material it surely should be possible to provide an appendix with the numerical information?
- Log in to post comments

Comments
mahabritannia
Wed, 02/05/2018 - 2:00pm
Permalink
False Positives?